LeapFrog 2009 Annual Report Download - page 45
Download and view the complete annual report
Please find page 45 of the 2009 LeapFrog annual report below. You can navigate through the pages in the report by either clicking on the pages listed below, or by using the keyword search tool below to find specific information within the annual report.-
 1
1 -
2
-
3
-
4
-
5
-
6
-
7
-
8
-
9
-
10
-
11
-
12
-
13
-
14
-
15
-
16
-
17
-
18
-
19
-
20
-
21
-
22
-
23
-
24
-
25
-
26
-
27
-
28
-
29
-
30
-
31
-
32
-
33
-
34
-
 35
35 -
 36
36 -
 37
37 -
 38
38 -
 39
39 -
 40
40 -
 41
41 -
 42
42 -
 43
43 -
 44
44 -
 45
45 -
 46
46 -
 47
47 -
 48
48 -
 49
49 -
 50
50 -
 51
51 -
 52
52 -
 53
53 -
 54
54 -
 55
55 -
56
-
57
-
58
-
59
-
60
-
61
-
62
-
63
-
64
-
65
-
66
-
67
-
68
-
69
-
70
-
71
-
72
-
73
-
74
-
75
-
76
-
77
-
78
-
79
-
80
-
81
-
82
-
83
-
84
-
85
-
86
-
87
-
88
-
89
-
90
-
91
-
92
-
93
-
94
-
95
-
96
-
97
-
98
-
99
-
100
-
101
-
102
-
103
-
104
-
105
-
106
-
107
-
108
-
109
-
110
-
111
-
112
-
113
-
114
-
115
-
116
-
117
-
118
-
119
-
120
-
121
-
122
-
123
-
124
-
125
-
126
-
127
-
128
-
129
-
130
-
131
-
132
-
133
-
134
-
135
-
136
-
137
-
138
-
139
-
140
-
141
-
142
-
143
-
144
-
145
-
146
-
147
-
148
-
149
-
150
-
151
-
152
-
153
-
154
-
155
-
156
-
157
-
158
-
159
-
160
-
161
-
162
-
163
-
164
-
165
-
166
-
167
-
168
-
169
-
170
-
171
-
172
-
173
-
174
-
175
-
176
-
177
-
178
-
179
-
180
 |
 |

business, primarily the allowances for bad debts, sales and product returns; a decrease in inventories of $28.9
million in 2008, primarily attributable to increased allowances for potential product returns including those
affected by the 2008 CPSIA safety regulations and a $30.2 million decrease in accrued liabilities and deferred
revenue in 2008 caused by lower accruals for employee bonuses, legal settlement expenses and general
marketing expenses in 2008.
Net cash flow used in investing activities increased by $64.3 million in 2008 as net proceeds from the sales and
purchases of investments declined by $67.6 million, offset by a $3.3 million decline in capital expenditures.
Net cash used by financing activities increased by $2.1 million as proceeds from stock option exercises and
employee stock purchase plans declined significantly due to the deteriorating stock price in 2008 which
depressed stock purchases.
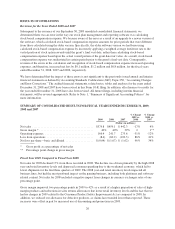
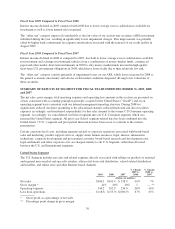
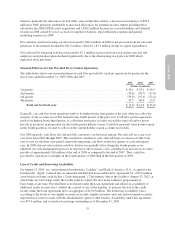
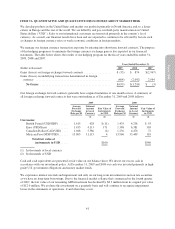
Seasonal Patterns of Cash Provided By or Used in Operations
The table below shows our seasonal patterns of cash flow provided by (used in) operations by quarter for the
fiscal years ended December 31, 2009, 2008 and 2007.
2009 2008 2007
(Dollars in millions)
1st quarter ............................................................. $10.1 $ 18.1 $ 49.6
2nd quarter ............................................................ (20.6) (30.7) (37.6)
3rd quarter ............................................................ (39.8) (35.4) (52.4)
4th quarter ............................................................ 45.3 60.0 25.0
Total, net for fiscal year ............................................. $ (5.0) $ 12.0 $(15.4)
Generally, our cash flow from operations tends to be highest in the first quarter of the year when we collect the
majority of our accounts receivable booked in the fourth quarter of the prior year. Cash flow used in operations
tends to be highest in our third quarter, as collections from prior accounts receivables taper off and we invest
heavily in inventory in preparation for the fourth quarter holiday season. Cash flow generally turns positive again
in the fourth quarter as we start to collect on the current holiday season accounts receivables.
Our 2008 quarterly cash flows also did not fully conform to our historical pattern. Net sales fell on a year-over-
year basis from 2005 through 2007. This resulted in a decline in cash collected from accounts receivable from
year to year for the three-year period, negatively impacting cash flows in the first quarter of each subsequent
year. In 2008, this net sales-related cash flow decline was partially offset during the fourth quarter as we
tightened our cash management practices in response to the economic crisis, resulting in an increase in accounts
payable of approximately $10 million at the end of 2008 as compared to the end of 2007. Thus, cash flow
provided by operations was higher in the fourth quarter of 2008 than in the first quarter of 2009.
Line of Credit and Borrowing Availability
On August 13, 2009, we, certain financial institutions (“Lenders”) and Bank of America, N.A., as agent for the
Lenders (the “Agent”) entered into an Amended and Restated Loan and Security Agreement for a $75.0 million
asset-based revolving credit facility (“Loan Agreement”). The maturity date of the facility is August 13, 2012, at
which time any borrowings under the facility must be repaid. We may make voluntary prepayments of
borrowings at any time. Provided there is no default under the Loan Agreement and subject to availability of
additional credit, we may elect, without the consent of any of the Lenders, to increase the size of the credit
facility under the Loan Agreement up to an aggregate of $150.0 million. The borrowing availability varies
according to the levels of our eligible accounts receivable, eligible inventory and cash and investment securities
deposited in secured accounts with the administrative agent or other lenders. Availability under this agreement
was $75.0 million, and we had no borrowings outstanding as of December 31, 2009.
35