LeapFrog 2009 Annual Report Download - page 70
Download and view the complete annual report
Please find page 70 of the 2009 LeapFrog annual report below. You can navigate through the pages in the report by either clicking on the pages listed below, or by using the keyword search tool below to find specific information within the annual report.-
 1
1 -
2
-
3
-
4
-
5
-
6
-
7
-
8
-
9
-
10
-
11
-
12
-
13
-
14
-
15
-
16
-
17
-
18
-
19
-
20
-
21
-
22
-
23
-
24
-
25
-
26
-
27
-
28
-
29
-
30
-
31
-
32
-
33
-
34
-
35
-
36
-
37
-
38
-
39
-
40
-
41
-
42
-
43
-
44
-
45
-
46
-
47
-
48
-
49
-
50
-
51
-
52
-
53
-
54
-
55
-
56
-
57
-
58
-
59
-
 60
60 -
 61
61 -
 62
62 -
 63
63 -
 64
64 -
 65
65 -
 66
66 -
 67
67 -
 68
68 -
 69
69 -
 70
70 -
 71
71 -
 72
72 -
 73
73 -
 74
74 -
 75
75 -
 76
76 -
 77
77 -
 78
78 -
 79
79 -
 80
80 -
81
-
82
-
83
-
84
-
85
-
86
-
87
-
88
-
89
-
90
-
91
-
92
-
93
-
94
-
95
-
96
-
97
-
98
-
99
-
100
-
101
-
102
-
103
-
104
-
105
-
106
-
107
-
108
-
109
-
110
-
111
-
112
-
113
-
114
-
115
-
116
-
117
-
118
-
119
-
120
-
121
-
122
-
123
-
124
-
125
-
126
-
127
-
128
-
129
-
130
-
131
-
132
-
133
-
134
-
135
-
136
-
137
-
138
-
139
-
140
-
141
-
142
-
143
-
144
-
145
-
146
-
147
-
148
-
149
-
150
-
151
-
152
-
153
-
154
-
155
-
156
-
157
-
158
-
159
-
160
-
161
-
162
-
163
-
164
-
165
-
166
-
167
-
168
-
169
-
170
-
171
-
172
-
173
-
174
-
175
-
176
-
177
-
178
-
179
-
180
 |
 |

LEAPFROG ENTERPRISES, INC.
NOTES TO THE CONSOLIDATED FINANCIAL STATEMENTS
(In thousands, except per share data)
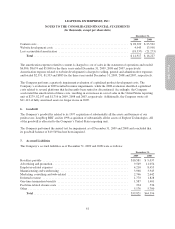
During 2009, 2008 and 2007, the Company recorded net sales of inventory written down in the previous year
resulting in a benefit to gross margin of $2,899, $1,016 and $4,853, respectively.
At December 31, 2009 and 2008, the Company accrued liabilities for cancelled purchase orders totaling $0 and
$751, respectively. The inventories related to these purchase orders are returned to the Company and recorded
either in raw materials or work in process.
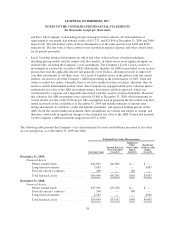
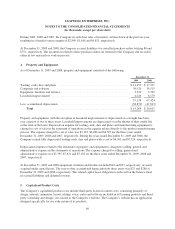
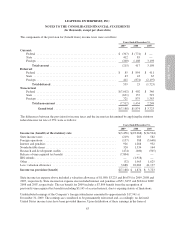
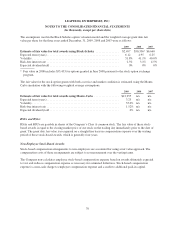
4. Property and Equipment
As of December 31, 2009 and 2008, property and equipment consisted of the following:
December 31,
2009 2008
Tooling, cards, dies and plates ................................................ $14,053 $ 17,331
Computers and software ..................................................... 30,920 38,515
Equipment, furniture and fixtures .............................................. 3,939 5,399
Leasehold improvements .................................................... 4,226 6,179
53,138 67,424
Less: accumulated depreciation ............................................... (38,870) (47,813)
Total ................................................................ $14,268 $ 19,611
Property and equipment, with the exception of leasehold improvements is depreciated on a straight-line basis
over a period of two to three years. Leasehold improvements are depreciated over the shorter of their useful life
or the term of the lease. Depreciation expense for tooling cards, dies and plates and manufacturing equipment is
charged to cost of sales in the statement of operations as the expense relates directly to the product manufacturing
process. The expense charged to cost of sales was $3,193, $2,486 and $4,307 for the three years ended
December 31, 2009, 2008 and 2007, respectively. During the years ended December 31, 2009 and 2008, the
Company retired fully depreciated tooling cards, dies and plates with a cost of $4,301 and $7,524, respectively.
Depreciation expense related to the remainder of property and equipment is charged to selling, general and
administrative expense in the statements of operations. The expense charged to selling, general and
administrative expense was $7,395, $7,631 and $7,158 for the three years ended December 31, 2009, 2008 and
2007, respectively.
At December 31, 2009 and 2008 equipment, furniture and fixtures included $10 and $33, respectively, of assets
acquired under capital leases. The year-to-date accumulated depreciation on these assets was $23 and $288 at
December 31, 2009 and 2008, respectively. The related capital lease obligation is reflected on the balance sheet
in accrued liabilities and deferred revenue.
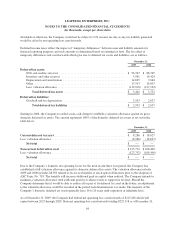
5. Capitalized Product Costs
The Company’s capitalized product costs include third-party licensed content costs, consisting primarily of
design, artwork, animation, layout, editing, voice, audio and software included in its learning products and third-
party consulting and design costs related to the Company’s website. The Company’s website has an application
designed specifically for use with certain of its products.
60