Medtronic 2011 Annual Report Download - page 41
Download and view the complete annual report
Please find page 41 of the 2011 Medtronic annual report below. You can navigate through the pages in the report by either clicking on the pages listed below, or by using the keyword search tool below to find specific information within the annual report.-
 1
1 -
2
-
3
-
4
-
5
-
6
-
7
-
8
-
9
-
10
-
11
-
12
-
13
-
14
-
15
-
16
-
17
-
18
-
19
-
20
-
21
-
22
-
23
-
24
-
25
-
26
-
27
-
28
-
29
-
30
-
 31
31 -
 32
32 -
 33
33 -
 34
34 -
 35
35 -
 36
36 -
 37
37 -
 38
38 -
 39
39 -
 40
40 -
 41
41 -
 42
42 -
 43
43 -
 44
44 -
 45
45 -
 46
46 -
 47
47 -
 48
48 -
 49
49 -
 50
50 -
 51
51 -
52
-
53
-
54
-
55
-
56
-
57
-
58
-
59
-
60
-
61
-
62
-
63
-
64
-
65
-
66
-
67
-
68
-
69
-
70
-
71
-
72
-
73
-
74
-
75
-
76
-
77
-
78
-
79
-
80
-
81
-
82
-
83
-
84
-
85
-
86
-
87
-
88
-
89
-
90
-
91
-
92
-
93
-
94
-
95
-
96
-
97
-
98
-
99
-
100
-
101
-
102
-
103
-
104
-
105
-
106
 |
 |

37
Medtronic, Inc.
repatriated to the U.S. or used for U.S. operations, the amounts
would generally be subject to U.S. tax. As a result, we continue to
accumulate earnings overseas for investment outside the U.S. and
to use cash generated from U.S. operations and short- and long-
term borrowings to meet our U.S. cash needs. Should we require
more capital in the U.S. than is generated by our domestic
operations, we could elect to repatriate earnings from our non-
U.S. subsidiaries or raise additional capital in the U.S. through
debt or equity issuances. These alternatives could result in higher
effective tax rates, increased interest expense, or other dilution of
our earnings.
Long-term investments at April 29, 2011 also include $155
million of cash invested in government securities held in an
indemnification trust established for self-insurance coverage for
our directors and officers. These investments are restricted and
can only be used to indemnify or advance expenses related to
claims against our directors and/or officers.
We have investments in marketable debt securities t hat are
classified and accounted for as available-for-sale. Our debt
securities include U.S. government and agency securities, foreign
government and agency securities, corporate debt securities,
certificates of deposit, mortgage-backed securities, other asset-
backed securities, and auction rate securities. Some of our
investments may experience reduced liquidity due to changes in
market conditions and investor demand. Our auction rate security
holdings have experienced reduced liquidity due to the change
in investor demand. Although our auction rate securities are
currently illiquid and other securities could become illiquid, we
believe we could liquidate a substantial amount of our portfolio
without incurring a material impairment loss.
For the fiscal year ended April 29, 2011, other-than-temporary
impairment losses on available-for-sale debt securities were
$18 million, of which $13 million was recognized in other
comprehensive income resulting in $5 million of charges being
recognized in earnings. For the fiscal year ended April 30, 2010,
other-than-temporary impairment losses on available-for-sale
debt securities were $29 million, of which $15 million was
recognized in other comprehensive income resulting in $14
million of charges being recognized in earnings. In determining
these other-than-temporary impairment losses, U.S. GAAP
specifies that we consider a variety of factors, including the
quality and estimated value of the underlying credit support for
our holdings and the financial condition and credit rating of the
issuer in estimating the credit loss portion of other-than-
temporary impairment losses. Based on our assessment of the
credit quality of the underlying collateral and credit support
available to each of the remaining securities in which we are
invested, we believe we have recorded all necessary other-
than-temporary impairments as we do not have the intent to
sell nor is it more likely than not that we will be required to sell
before recovery of the amortized cost. However, as of April 29,
2011, we have $56 million of gross unrealized losses on our
aggregate short-term and long-term available-for-sale debt
securities of $6.471 billion; if market conditions deteriorate, some
of these holdings may experience other-than-temporary
impairment in the future which could have a material impact on
our financial results. Management is required to use estimates
and assumptions in its valuation of our investments, which
requires a high degree of judgment, and therefore actual results
could differ materially from those estimates. See Note 6 to
the consolidated financial statements for additional information
regarding fair value measurements.
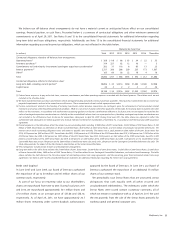
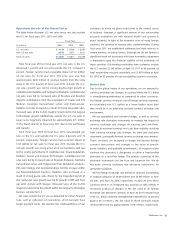
Summary of Cash Flows
Fiscal Year
(in millions) 2011 2010 2009
Cash provided by (used in):
Operating activities $ 3,741 $ 4,131 $ 3,878
Investing activitie s (1,815) (4,759) (2,740)
Financing activities (2,006) 764 (845)
Effect of exchange rate changes
on cash and cash equivalents 62 (7) (82)
Net change in cash and cash
equivalents $ (18) $ 129 $ 211
Operating Activities Our net cash provided by operating activities
was $3.741 billion for the fiscal year ended April 29, 2011 compared
to $4.131 billion for the same period of the prior year. The $390
million decrease in net cash provided by operating activities
is primarily attributable to changes in working capital needs
resulting from increased accounts receivable balances in certain
European Union countries and increased global pension
contributions compared to the prior fiscal year.
Our net cash provided by operating activities was $4.131 billion
for the fiscal year ended April 30, 2010 compared to $3.878 billion
for the fiscal year ended April 24, 2009. The $253 million increase
in net cash provided by operating activities was primarily
attributable to the increase in earnings offset by an increase in
certain litigation payments.
Investing Activities Our net cash used in investing activities was
$1.815 billion for the fiscal year ended April 29, 2011 compared to
$4.759 billion for the fiscal year ended April 30, 2010. Cash used