Pier 1 2008 Annual Report Download - page 18
Download and view the complete annual report
Please find page 18 of the 2008 Pier 1 annual report below. You can navigate through the pages in the report by either clicking on the pages listed below, or by using the keyword search tool below to find specific information within the annual report.-
 1
1 -
2
-
3
-
4
-
5
-
6
-
7
-
 8
8 -
 9
9 -
 10
10 -
 11
11 -
 12
12 -
 13
13 -
 14
14 -
 15
15 -
 16
16 -
 17
17 -
 18
18 -
 19
19 -
 20
20 -
 21
21 -
 22
22 -
 23
23 -
 24
24 -
 25
25 -
 26
26 -
 27
27 -
 28
28 -
29
-
30
-
31
-
32
-
33
-
34
-
35
-
36
-
37
-
38
-
39
-
40
-
41
-
42
-
43
-
44
-
45
-
46
-
47
-
48
-
49
-
50
-
51
-
52
-
53
-
54
-
55
-
56
-
57
-
58
-
59
-
60
-
61
-
62
-
63
-
64
-
65
-
66
-
67
-
68
-
69
-
70
-
71
-
72
-
73
-
74
-
75
-
76
-
77
-
78
-
79
-
80
-
81
-
82
-
83
-
84
-
85
-
86
-
87
-
88
-
89
-
90
-
91
-
92
-
93
-
94
-
95
-
96
-
97
-
98
-
99
-
100
-
101
-
102
-
103
-
104
-
105
-
106
-
107
-
108
-
109
-
110
-
111
-
112
-
113
-
114
-
115
-
116
-
117
-
118
-
119
-
120
-
121
-
122
-
123
-
124
-
125
-
126
-
127
-
128
-
129
-
130
-
131
-
132
-
133
-
134
-
135
-
136
-
137
-
138
-
139
-
140
 |
 |

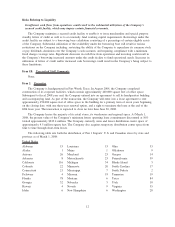
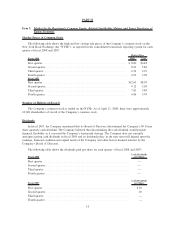
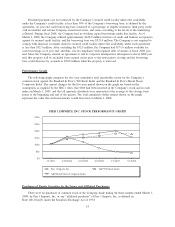
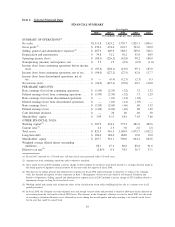
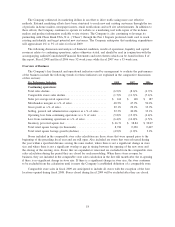
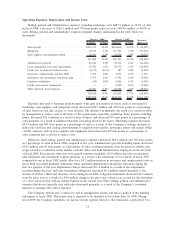
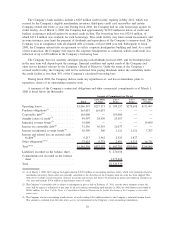
Item 6. Selected Financial Data.
FINANCIAL SUMMARY
2008 2007
(1)
2006 2005 2004
Year Ended
($ In millions except per share amounts)
SUMMARY OF OPERATIONS
(2)
:
Net sales ................................... $1,511.8 1,623.2 1,776.7 1,825.3 1,806.1
Gross profit
(3)
................................ $ 439.6 474.0 601.7 703.6 760.9
Selling, general and administrative expenses
(4)
....... $ 487.9 649.0 588.3 549.6 526.1
Depreciation and amortization ................... $ 39.8 51.2 56.2 55.8 48.9
Operating income (loss) ........................ $ (88.1) (226.2) (42.8) 98.2 186.0
Nonoperating (income) and expenses, net ........... $ 5.3 1.9 (0.9) (0.9) (1.0)
Income (loss) from continuing operations before income
taxes .................................... $ (93.4) (228.1) (41.9) 99.1 187.0
Income (loss) from continuing operations, net of tax . . . $ (96.0) (227.2) (27.5) 62.8 117.7
Income (loss) from discontinued operations, net of
tax...................................... $ — (0.4) (12.3) (2.3) 0.3
Net income (loss) ............................. $ (96.0) (227.6) (39.8) 60.5 118.0
PER SHARE AMOUNTS:
Basic earnings (loss) from continuing operations . . .... $ (1.09) (2.59) (.32) .72 1.32
Diluted earnings (loss) from continuing operations .... $ (1.09) (2.59) (.32) .71 1.29
Basic earnings (loss) from discontinued operations .... $ — (.01) (.14) (.03) —
Diluted earnings (loss) from discontinued operations . . . $ — (.01) (.14) (.03) —
Basic earnings (loss)........................... $ (1.09) (2.60) (.46) .69 1.32
Diluted earnings (loss) ......................... $ (1.09) (2.60) (.46) .68 1.29
Cash dividends declared ........................ $ — .20 .40 .40 .30
Shareholders’ equity ........................... $ 3.04 4.13 6.81 7.63 7.66
OTHER FINANCIAL DATA:
Working capital
(5)
............................. $ 387.9 434.6 575.2 481.0 499.6
Current ratio
(5)
............................... 2.4 2.5 3.0 2.6 2.8
Total assets ................................. $ 821.9 916.5 1,169.9 1,075.7 1,052.2
Long-term debt .............................. $ 184.0 184.0 184.0 19.0 19.0
Shareholders’ equity ........................... $ 267.7 361.1 590.0 664.4 683.6
Weighted average diluted shares outstanding
(millions) ................................. 88.1 87.4 86.6 88.8 91.6
Effective tax rate
(6)
............................ (2.8)% 0.4 34.5 36.7 37.1
(1) Fiscal 2007 consisted of a 53-week year. All other fiscal years presented reflect 52-week years.
(2) Amounts are from continuing operations unless otherwise specified.
(3) Gross profit for fiscal 2007 included a pre-tax charge of $32.5 million for inventory write-down related to a strategic decision made in
the fourth quarter to liquidate certain inventory by the end of the first quarter of fiscal 2008.
(4) The decrease in selling, general and administrative expense for fiscal 2008 relates primarily to initiatives to reduce costs company-
wide. See detailed description of these reductions in Item 7. Management’s Discussion and Analysis of Financial Condition and
Results of Operations. Selling, general and administrative expense in fiscal 2007 included a pre-tax charge of $32.3 million related to
impairment charges on long-lived store level assets.
(5) Working capital and current ratio include the effect of the classification of the office building held for sale as a current asset in all
periods presented.
(6) In fiscal 2008, the Company recorded minimal state and foreign tax provisions and provided a valuation allowance on the deferred tax
asset arising from the tax benefit of fiscal 2008 losses. The decrease in the Company’s effective tax rate for fiscal 2007 was the result
of recording a valuation allowance on its deferred tax assets during the second quarter and only recording a tax benefit on the losses
for the year that could be carried back.
16