Pier 1 2008 Annual Report Download - page 26
Download and view the complete annual report
Please find page 26 of the 2008 Pier 1 annual report below. You can navigate through the pages in the report by either clicking on the pages listed below, or by using the keyword search tool below to find specific information within the annual report.-
 1
1 -
2
-
3
-
4
-
5
-
6
-
7
-
8
-
9
-
10
-
11
-
12
-
13
-
14
-
15
-
 16
16 -
 17
17 -
 18
18 -
 19
19 -
 20
20 -
 21
21 -
 22
22 -
 23
23 -
 24
24 -
 25
25 -
 26
26 -
 27
27 -
 28
28 -
 29
29 -
 30
30 -
 31
31 -
 32
32 -
 33
33 -
 34
34 -
 35
35 -
 36
36 -
37
-
38
-
39
-
40
-
41
-
42
-
43
-
44
-
45
-
46
-
47
-
48
-
49
-
50
-
51
-
52
-
53
-
54
-
55
-
56
-
57
-
58
-
59
-
60
-
61
-
62
-
63
-
64
-
65
-
66
-
67
-
68
-
69
-
70
-
71
-
72
-
73
-
74
-
75
-
76
-
77
-
78
-
79
-
80
-
81
-
82
-
83
-
84
-
85
-
86
-
87
-
88
-
89
-
90
-
91
-
92
-
93
-
94
-
95
-
96
-
97
-
98
-
99
-
100
-
101
-
102
-
103
-
104
-
105
-
106
-
107
-
108
-
109
-
110
-
111
-
112
-
113
-
114
-
115
-
116
-
117
-
118
-
119
-
120
-
121
-
122
-
123
-
124
-
125
-
126
-
127
-
128
-
129
-
130
-
131
-
132
-
133
-
134
-
135
-
136
-
137
-
138
-
139
-
140
 |
 |

fiscal 2006. This increase was primarily due to the deleveraging of relatively fixed rental costs over a lower
sales base and an increase in rental expense, property taxes and utility costs.
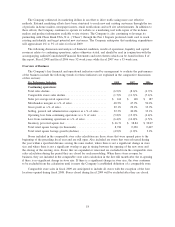
Operating Expenses, Depreciation and Income Taxes
Selling, general and administrative expenses, including marketing, comprised 40.0% of sales in fiscal
2007, an increase of 690 basis points over 33.1% of sales in fiscal 2006. In total dollars, selling, general and
administrative expenses increased $60.7 million in fiscal 2007 over fiscal 2006; $50.3 million of this increase
is summarized in the table below. Expenses that fluctuate to some degree proportionately with sales and
number of new stores, such as store payroll, marketing, store supplies, and equipment rental, increased
$8.5 million. These variable expenses increased 280 basis points as a percentage of sales for fiscal 2007
compared to fiscal 2006. Marketing expense increased $13.9 million or 140 basis points as a percentage of
sales. During fiscal 2007, the Company increased both the number of different catalogs published and the
circulation while maintaining its other marketing initiatives that were focused on driving sales and reinforcing
its brand position. Store salaries, including bonus, decreased $3.5 million from fiscal 2006, yet increased
120 basis points as a percentage of sales, as sales were insufficient to leverage certain fixed portions of store
payroll costs incurred to maintain minimum staffing levels to provide quality customer service. Other variable
expenses such as equipment rental and store supplies decreased $1.9 million, yet increased 20 basis points as a
percentage of sales.
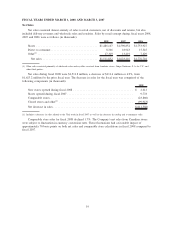
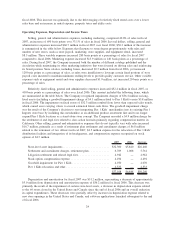
Relatively fixed selling, general and administrative expenses increased $52.2 million in fiscal 2007, or
410 basis points as a percentage of sales over fiscal 2006. This amount included the following items, which
are summarized in the table below. The Company recognized impairment charges of $36.4 million on long-
lived assets (including a goodwill impairment charge of $4.1 million related to Pier 1 Kids) versus $5.8 million
in fiscal 2006. The impairment on fixed assets of $32.3 million resulted from lower than expected sales trends,
which caused asset carrying values to exceed estimated future cash flows. The goodwill impairment charge
was the result of the Company’s decision to start integrating Pier 1 Kids’ merchandise into its existing Pier 1
Imports store base by including this merchandise as an additional product assortment line and to no longer
expand Pier 1 Kids locations as a stand-alone store concept. The Company recorded a $4.9 million charge for
the settlement of and legal fees related to class action lawsuits primarily regarding compensation matters in
California. Other selling, general and administrative expenses that do not typically vary with sales increased
$16.7 million, primarily as a result of retirement plan settlement and curtailment charges of $6.8 million
related to the retirement of two officers in fiscal 2007, $4.5 million expense for the relocation of Pier 1 Kids’
distribution facilities and integration of its headquarters, and compensation expense recognized on stock
options of $4.5 million.
2007 2006 Increase
Store-level asset impairments .............................. $32,300 $5,840 $26,460
Settlement and curtailment charges, retirement plan ............. 6,769 1,008 5,761
Litigation settlement and related legal fees .................... 4,942 — 4,942
Stock option compensation expense ......................... 4,494 — 4,494
Goodwill impairment for Pier 1 Kids ........................ 4,070 — 4,070
Pier 1 Kids relocation and other ............................ 4,533 — 4,533
$57,108 $6,848 $50,260
Depreciation and amortization for fiscal 2007 was $51.2 million, representing a decrease of approximately
$5.0 million from depreciation and amortization expense of $56.2 million for fiscal 2006. This decrease was
primarily the result of the impairment of certain store-level assets, a decrease in depreciation expense related
to the 64 stores closed in the United States and Canada since the end of fiscal 2006 and an overall reduction
in capital expenditures. These decreases were partially offset by increases in depreciation expense related to
new store openings in the United States and Canada, and software applications launched subsequent to the end
of fiscal 2006.
24