Pier 1 2008 Annual Report Download - page 55
Download and view the complete annual report
Please find page 55 of the 2008 Pier 1 annual report below. You can navigate through the pages in the report by either clicking on the pages listed below, or by using the keyword search tool below to find specific information within the annual report.-
 1
1 -
2
-
3
-
4
-
5
-
6
-
7
-
8
-
9
-
10
-
11
-
12
-
13
-
14
-
15
-
16
-
17
-
18
-
19
-
20
-
21
-
22
-
23
-
24
-
25
-
26
-
27
-
28
-
29
-
30
-
31
-
32
-
33
-
34
-
35
-
36
-
37
-
38
-
39
-
40
-
41
-
42
-
43
-
44
-
 45
45 -
 46
46 -
 47
47 -
 48
48 -
 49
49 -
 50
50 -
 51
51 -
 52
52 -
 53
53 -
 54
54 -
 55
55 -
 56
56 -
 57
57 -
 58
58 -
 59
59 -
 60
60 -
 61
61 -
 62
62 -
 63
63 -
 64
64 -
 65
65 -
66
-
67
-
68
-
69
-
70
-
71
-
72
-
73
-
74
-
75
-
76
-
77
-
78
-
79
-
80
-
81
-
82
-
83
-
84
-
85
-
86
-
87
-
88
-
89
-
90
-
91
-
92
-
93
-
94
-
95
-
96
-
97
-
98
-
99
-
100
-
101
-
102
-
103
-
104
-
105
-
106
-
107
-
108
-
109
-
110
-
111
-
112
-
113
-
114
-
115
-
116
-
117
-
118
-
119
-
120
-
121
-
122
-
123
-
124
-
125
-
126
-
127
-
128
-
129
-
130
-
131
-
132
-
133
-
134
-
135
-
136
-
137
-
138
-
139
-
140
 |
 |

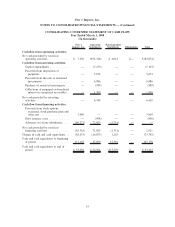
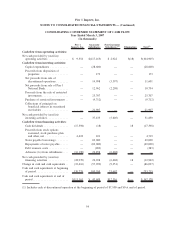
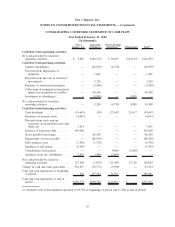
CONSOLIDATING CONDENSED STATEMENT OF CASH FLOW
Year Ended March 1, 2008
(In thousands)
Pier 1
Imports, Inc.
Guarantor
Subsidiaries
Non-Guarantor
Subsidiaries Eliminations Total
Cash flow from operating activities:
Net cash provided by (used in)
operating activities .............. $ 7,230 $(94,318) $ 4,014 $— $ (83,074)
Cash flow from investing activities:
Capital expenditures ............. — (7,153) — — (7,153)
Proceeds from disposition of
properties ................... — 5,674 — — 5,674
Proceeds from the sale of restricted
investments.................. — 6,986 — — 6,986
Purchase of restricted investments . . . — (589) — — (589)
Collections of principal on beneficial
interest in securitized receivables. . — 1,500 — — 1,500
Net cash provided by investing
activities ..................... — 6,418 — — 6,418
Cash flow from financing activities:
Proceeds from stock options
exercised, stock purchase plan and
other, net ................... 3,909 — — — 3,909
Debt issuance costs ............. — (998) — — (998)
Advances (to) from subsidiaries . . . . (69,272) 72,023 (2,751) — —
Net cash provided by (used in)
financing activities .............. (65,363) 71,025 (2,751) — 2,911
Change in cash and cash equivalents . . . (58,133) (16,875) 1,263 — (73,745)
Cash and cash equivalents at beginning
of period ..................... 111,163 43,699 12,316 — 167,178
Cash and cash equivalents at end of
period ....................... $ 53,030 $ 26,824 $13,579 $— $ 93,433
53
Pier 1 Imports, Inc.
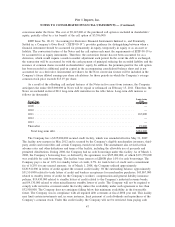
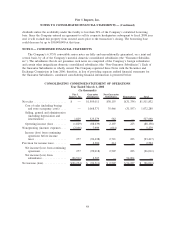
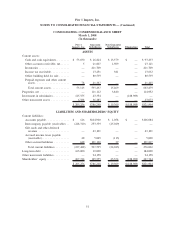
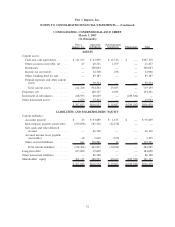
NOTES TO CONSOLIDATED FINANCIAL STATEMENTS — (Continued)