Pier 1 2008 Annual Report Download - page 22
Download and view the complete annual report
Please find page 22 of the 2008 Pier 1 annual report below. You can navigate through the pages in the report by either clicking on the pages listed below, or by using the keyword search tool below to find specific information within the annual report.-
 1
1 -
2
-
3
-
4
-
5
-
6
-
7
-
8
-
9
-
10
-
11
-
 12
12 -
 13
13 -
 14
14 -
 15
15 -
 16
16 -
 17
17 -
 18
18 -
 19
19 -
 20
20 -
 21
21 -
 22
22 -
 23
23 -
 24
24 -
 25
25 -
 26
26 -
 27
27 -
 28
28 -
 29
29 -
 30
30 -
 31
31 -
 32
32 -
33
-
34
-
35
-
36
-
37
-
38
-
39
-
40
-
41
-
42
-
43
-
44
-
45
-
46
-
47
-
48
-
49
-
50
-
51
-
52
-
53
-
54
-
55
-
56
-
57
-
58
-
59
-
60
-
61
-
62
-
63
-
64
-
65
-
66
-
67
-
68
-
69
-
70
-
71
-
72
-
73
-
74
-
75
-
76
-
77
-
78
-
79
-
80
-
81
-
82
-
83
-
84
-
85
-
86
-
87
-
88
-
89
-
90
-
91
-
92
-
93
-
94
-
95
-
96
-
97
-
98
-
99
-
100
-
101
-
102
-
103
-
104
-
105
-
106
-
107
-
108
-
109
-
110
-
111
-
112
-
113
-
114
-
115
-
116
-
117
-
118
-
119
-
120
-
121
-
122
-
123
-
124
-
125
-
126
-
127
-
128
-
129
-
130
-
131
-
132
-
133
-
134
-
135
-
136
-
137
-
138
-
139
-
140
 |
 |

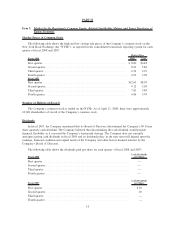
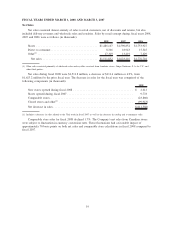
During fiscal 2008, the Company opened four new stores and closed 83 store locations, including all Pier
1 Kids and clearance stores. In addition, the Company closed its direct to consumer business. As of March 1,
2008, the Company operated 1,117 stores in the United States and Canada. The Company continues to
evaluate its real estate portfolio on a store-by-store and market-by-market basis and will open or close stores
as deemed appropriate. During fiscal 2009, the Company expects to open up to three new Pier 1 Imports stores
and close approximately 25 stores. A summary reconciliation of the Company’s stores open at the beginning
of fiscal 2008, 2007 and 2006 to the number open at the end of each period follows (openings and closings
include relocated stores):
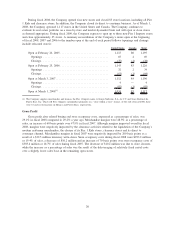
United States Canada Total
Open at February 26, 2005 ............................... 1,115 80 1,195
Openings .......................................... 65 4 69
Closings ........................................... (37) (1) (38)
Open at February 25, 2006 ............................... 1,143 83 1,226
Openings .......................................... 32 2 34
Closings ........................................... (63) (1) (64)
Open at March 3, 2007 .................................. 1,112 84 1,196
Openings .......................................... 4 — 4
Closings ........................................... (82) (1) (83)
Open at March 1, 2008
(1)
................................ 1,034 83 1,117
(1) The Company supplies merchandise and licenses the Pier 1 Imports name to Grupo Sanborns, S.A. de C.V. and Sears Roebuck de
Puerto Rico, Inc. which sell Pier 1 Imports merchandise primarily in a “store within a store” format. At the end of fiscal 2008, there
were 31 and seven locations in Mexico and Puerto Rico, respectively.
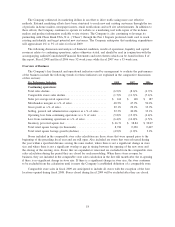
Gross Profit
Gross profit after related buying and store occupancy costs, expressed as a percentage of sales, was
29.1% in fiscal 2008 compared to 29.2% a year ago. Merchandise margins were 48.5% as a percentage of
sales, an increase of 60 basis points over 47.9% in fiscal 2007. Although margins improved overall in fiscal
2008, margins were negatively impacted by the clearance activities related to the liquidation of the Company’s
modern craftsmen merchandise, the closure of its Pier 1 Kids stores, clearance stores and its direct to
consumer channel. Merchandise margins in fiscal 2007 were negatively impacted by 200 basis points as a
result of a $32.5 million inventory write-down. Store occupancy costs during fiscal 2008 were $293.2 million
or 19.4% of sales, a decrease of $10.2 million and an increase of 70 basis points over store occupancy costs of
$303.4 million or 18.7% of sales during fiscal 2007. The decrease of $10.2 million was due to store closures,
while the increase as a percentage of sales was the result of the deleveraging of relatively fixed rental costs
over a slightly lower sales base in the remaining open stores.
20