Progress Energy 2009 Annual Report Download - page 159
Download and view the complete annual report
Please find page 159 of the 2009 Progress Energy annual report below. You can navigate through the pages in the report by either clicking on the pages listed below, or by using the keyword search tool below to find specific information within the annual report.-
 1
1 -
2
-
3
-
4
-
5
-
6
-
7
-
8
-
9
-
10
-
11
-
12
-
13
-
14
-
15
-
16
-
17
-
18
-
19
-
20
-
21
-
22
-
23
-
24
-
25
-
26
-
27
-
28
-
29
-
30
-
31
-
32
-
33
-
34
-
35
-
36
-
37
-
38
-
39
-
40
-
41
-
42
-
43
-
44
-
45
-
46
-
47
-
48
-
49
-
50
-
51
-
52
-
53
-
54
-
55
-
56
-
57
-
58
-
59
-
60
-
61
-
62
-
63
-
64
-
65
-
66
-
67
-
68
-
69
-
70
-
71
-
72
-
73
-
74
-
75
-
76
-
77
-
78
-
79
-
80
-
81
-
82
-
83
-
84
-
85
-
86
-
87
-
88
-
89
-
90
-
91
-
92
-
93
-
94
-
95
-
96
-
97
-
98
-
99
-
100
-
101
-
102
-
103
-
104
-
105
-
106
-
107
-
108
-
109
-
110
-
111
-
112
-
113
-
114
-
115
-
116
-
117
-
118
-
119
-
120
-
121
-
122
-
123
-
124
-
125
-
126
-
127
-
128
-
129
-
130
-
131
-
132
-
133
-
134
-
135
-
136
-
137
-
138
-
139
-
140
-
141
-
142
-
143
-
144
-
145
-
146
-
147
-
148
-
 149
149 -
 150
150 -
 151
151 -
 152
152 -
 153
153 -
 154
154 -
 155
155 -
 156
156 -
 157
157 -
 158
158 -
 159
159 -
 160
160 -
 161
161 -
 162
162 -
 163
163 -
 164
164 -
 165
165 -
 166
166 -
 167
167 -
 168
168 -
 169
169 -
170
-
171
-
172
-
173
-
174
-
175
-
176
-
177
-
178
-
179
-
180
-
181
-
182
-
183
-
184
-
185
-
186
-
187
-
188
-
189
-
190
-
191
-
192
-
193
-
194
-
195
-
196
-
197
-
198
-
199
-
200
-
201
-
202
-
203
-
204
-
205
-
206
-
207
-
208
-
209
-
210
-
211
-
212
-
213
-
214
-
215
-
216
-
217
-
218
-
219
-
220
-
221
-
222
-
223
-
224
-
225
-
226
-
227
-
228
 |
 |

Progress Energy Proxy Statement
21
COMPENSATION DISCUSSION AND ANALYSIS
This Compensation Discussion and Analysis (“CD&A”) has four parts. The first part describes the
Company’s executive compensation philosophy and provides an overview of the compensation program and
process. The second part describes each element of the Company’s executive compensation program. The third part
describes how the Organization and Compensation Committee of the Company’s Board of Directors (in this CD&A,
the “Committee”) applied each element to determine the compensation paid to each of the named executive officers
in the Summary Compensation Table on page 45 (the “named executive officers”) for the services they provided to
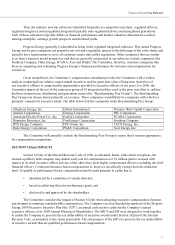
the Company in 2009. For 2009, the Company’s named executive officers were:
:LOOLDP'-RKQVRQ&KDLUPDQ3UHVLGHQWDQG&KLHI([HFXWLYH2IILFHU
0DUN)0XOKHUQ6HQLRU9LFH3UHVLGHQWDQG&KLHI)LQDQFLDO2IILFHU
-HIIUH\-/\DVK([HFXWLYH9LFH3UHVLGHQW±&RUSRUDWH'HYHORSPHQWIRUPHUO\3UHVLGHQWDQG&KLHI
Executive Officer, Progress Energy Florida, Inc. (PEF));
/OR\G0<DWHV3UHVLGHQWDQG&KLHI([HFXWLYH2IILFHU3URJUHVV(QHUJ\&DUROLQDV,QF3(&DQG
3DXOD-6LPV6HQLRU9LFH3UHVLGHQW±3RZHU2SHUDWLRQV
The fourth part consists of the Committee’s Report.
Following the CD&A are the tables setting forth the 2009 compensation for each of the named executive
officers, as well as a discussion concerning compensation for the members of the Company’s Board of Directors.
Throughout this CD&A, the Company is at times referred to as “we,” “our” or “us.”
I. COMPENSATION PHILOSOPHY AND OVERVIEW
We are an integrated electric utility primarily engaged in the regulated utility business. Our executive
compensation philosophy is designed to provide competitive and reasonable compensation consistent with the three
key principles that we believe are critical to our long-term success as described below:
Aligning the interests of shareholders and management. We believe that our major shareholders
invest in the Company because they believe we can produce average annual total shareholder
return in the 7% to 10% range over the long term. Total shareholder return is defined as the stock
price appreciation plus dividends over the period, divided by the share price at the beginning
of the measurement period. Further, our investors do not expect or desire significant volatility
in our stock price. Accordingly, our executive compensation program is designed to encourage
management to lead our Company in a way that consistently produces earnings per share growth
and a competitive dividend yield. In the two years since Mr. Johnson became our Chief Executive
Officer, under his leadership and that of the Committee, many actions have been taken to align the
executive compensation structure with our shareholders’ interests. These actions include a significant
reduction of perquisites for both our executive officers and non-executive officers who are in senior
management; an increase in the stock ownership guidelines; implementation of a new performance
measure in the Management Incentive Compensation Plan (“MICP”) to further enhance transparency
and alignment of performance and payouts for executive officers and non-executive officers in senior
management; and a modification of our Performance Share Sub-Plan (“PSSP”) to closely align awards
under that plan to our operating results, actual total shareholder returns, and, with respect to our peers,
relative total shareholder returns.