Progress Energy 2009 Annual Report Download - page 189
Download and view the complete annual report
Please find page 189 of the 2009 Progress Energy annual report below. You can navigate through the pages in the report by either clicking on the pages listed below, or by using the keyword search tool below to find specific information within the annual report.-
 1
1 -
2
-
3
-
4
-
5
-
6
-
7
-
8
-
9
-
10
-
11
-
12
-
13
-
14
-
15
-
16
-
17
-
18
-
19
-
20
-
21
-
22
-
23
-
24
-
25
-
26
-
27
-
28
-
29
-
30
-
31
-
32
-
33
-
34
-
35
-
36
-
37
-
38
-
39
-
40
-
41
-
42
-
43
-
44
-
45
-
46
-
47
-
48
-
49
-
50
-
51
-
52
-
53
-
54
-
55
-
56
-
57
-
58
-
59
-
60
-
61
-
62
-
63
-
64
-
65
-
66
-
67
-
68
-
69
-
70
-
71
-
72
-
73
-
74
-
75
-
76
-
77
-
78
-
79
-
80
-
81
-
82
-
83
-
84
-
85
-
86
-
87
-
88
-
89
-
90
-
91
-
92
-
93
-
94
-
95
-
96
-
97
-
98
-
99
-
100
-
101
-
102
-
103
-
104
-
105
-
106
-
107
-
108
-
109
-
110
-
111
-
112
-
113
-
114
-
115
-
116
-
117
-
118
-
119
-
120
-
121
-
122
-
123
-
124
-
125
-
126
-
127
-
128
-
129
-
130
-
131
-
132
-
133
-
134
-
135
-
136
-
137
-
138
-
139
-
140
-
141
-
142
-
143
-
144
-
145
-
146
-
147
-
148
-
149
-
150
-
151
-
152
-
153
-
154
-
155
-
156
-
157
-
158
-
159
-
160
-
161
-
162
-
163
-
164
-
165
-
166
-
167
-
168
-
169
-
170
-
171
-
172
-
173
-
174
-
175
-
176
-
177
-
178
-
 179
179 -
 180
180 -
 181
181 -
 182
182 -
 183
183 -
 184
184 -
 185
185 -
 186
186 -
 187
187 -
 188
188 -
 189
189 -
 190
190 -
 191
191 -
 192
192 -
 193
193 -
 194
194 -
 195
195 -
 196
196 -
 197
197 -
 198
198 -
 199
199 -
200
-
201
-
202
-
203
-
204
-
205
-
206
-
207
-
208
-
209
-
210
-
211
-
212
-
213
-
214
-
215
-
216
-
217
-
218
-
219
-
220
-
221
-
222
-
223
-
224
-
225
-
226
-
227
-
228
 |
 |

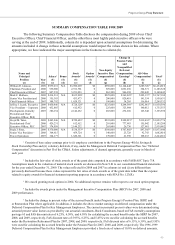
Progress Energy Proxy Statement
51
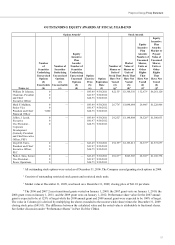
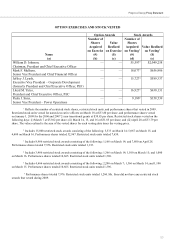
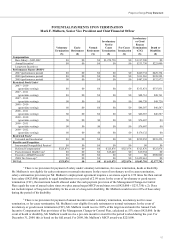
OUTSTANDING EQUITY AWARDS AT FISCAL YEAR-END
Option Awards1Stock Awards
Name (a)
Number
of
Securities
Underlying
Unexercised
Options
(#)
Exercisable
(b)
Number of
Securities
Underlying
Unexercised
Options
(#)
Unexercisable
(c)
Equity
Incentive
Plan
Awards:
Number of
Securities
Underlying
Unexercised
Unearned
Options
(#)
(d)
Option
Exercise
Price
($)
(e)
Option
Expiration
Date
(f)
Number of
Shares or
Units of
Stock That
Have Not
Vested
(#)
(g)2
Market
Value of
Shares or
Units of
Stock That
Have Not
Vested
($)
(h)3
Equity
Incentive
Plan
Awards:
Number of
Unearned
Shares,
Units or
Other
Rights
That
Have Not
Vested
(#)
(i)4
Equity
Incentive
Plan
Awards:
Market or
Payout
Value of
Unearned
Shares,
Units or
Other
Rights
That
Have Not
Vested
($)
(j)4
William D. Johnson,
Chairman, President
and Chief
Executive Officer
0
0
0
— — $43.49
$41.97
$44.75
9/30/2011
9/30/2012
9/30/2013
82,1355$3,368,356 152,6736$6,261,120
Mark F. Mulhern,
Senior Vice
President and Chief
Financial Officer
0
0
7,000
— — $43.49
$41.97
$44.75
9/30/2011
9/30/2012
9/30/2013
26,7767$1,098,084 29,9668$1,228,906
Jeffrey J. Lyash,
Executive
9LFH3UHVLGHQW±
Corporate
Development
(formerly President
and Chief Executive
Officer, PEF)
0
0
0
— — $43.49
$41.97
$44.75
9/30/2011
9/30/2012
9/30/2013
29,2329$1,198,804 38,52810 $1,580,033
Lloyd M. Yates,
President and Chief
Executive Officer,
PEC
0
0
0
— — $43.49
$41.97
$44.75
9/30/2011
9/30/2012
9/30/2013
29,15911 $1,195,811 38,37312 $1,573,677
Paula J. Sims, Senior
9LFH3UHVLGHQW±
Power Operations
0
0
0
— — $43.49
$41.97
$44.75
9/30/2011
9/30/2012
9/30/2013
20,61713 $845,503 28,30514 $1,160,778
1 All outstanding stock options were vested as of December 31, 2006. The Company ceased granting stock options in 2004.
2 Consists of outstanding restricted stock grants and restricted stock units.
3 Market value at December 31, 2009, was based on a December 31, 2009, closing price of $41.01 per share.
4 The 2006 and 2007 2-year transitional grants vested on January 1, 2009; the 2007 grant vests on January 1, 2010; the
2008 grant vests on January 1, 2011; and the 2009 grant vests on January 1, 2012. Performance share value for the 2007 annual
grant is expected to be at 125% of target while the 2008 annual grant and 2009 annual grant were expected to be 100% of target.
The value in Column (j) is derived by multiplying the shares (rounded to the nearest whole share) times the December 31, 2009
closing stock price ($41.01). The difference between the calculated value and the noted value is attributable to fractional shares.
See further discussion under “Performance Shares” in Part II of the CD&A.