Progress Energy 2009 Annual Report Download - page 178
Download and view the complete annual report
Please find page 178 of the 2009 Progress Energy annual report below. You can navigate through the pages in the report by either clicking on the pages listed below, or by using the keyword search tool below to find specific information within the annual report.-
 1
1 -
2
-
3
-
4
-
5
-
6
-
7
-
8
-
9
-
10
-
11
-
12
-
13
-
14
-
15
-
16
-
17
-
18
-
19
-
20
-
21
-
22
-
23
-
24
-
25
-
26
-
27
-
28
-
29
-
30
-
31
-
32
-
33
-
34
-
35
-
36
-
37
-
38
-
39
-
40
-
41
-
42
-
43
-
44
-
45
-
46
-
47
-
48
-
49
-
50
-
51
-
52
-
53
-
54
-
55
-
56
-
57
-
58
-
59
-
60
-
61
-
62
-
63
-
64
-
65
-
66
-
67
-
68
-
69
-
70
-
71
-
72
-
73
-
74
-
75
-
76
-
77
-
78
-
79
-
80
-
81
-
82
-
83
-
84
-
85
-
86
-
87
-
88
-
89
-
90
-
91
-
92
-
93
-
94
-
95
-
96
-
97
-
98
-
99
-
100
-
101
-
102
-
103
-
104
-
105
-
106
-
107
-
108
-
109
-
110
-
111
-
112
-
113
-
114
-
115
-
116
-
117
-
118
-
119
-
120
-
121
-
122
-
123
-
124
-
125
-
126
-
127
-
128
-
129
-
130
-
131
-
132
-
133
-
134
-
135
-
136
-
137
-
138
-
139
-
140
-
141
-
142
-
143
-
144
-
145
-
146
-
147
-
148
-
149
-
150
-
151
-
152
-
153
-
154
-
155
-
156
-
157
-
158
-
159
-
160
-
161
-
162
-
163
-
164
-
165
-
166
-
167
-
 168
168 -
 169
169 -
 170
170 -
 171
171 -
 172
172 -
 173
173 -
 174
174 -
 175
175 -
 176
176 -
 177
177 -
 178
178 -
 179
179 -
 180
180 -
 181
181 -
 182
182 -
 183
183 -
 184
184 -
 185
185 -
 186
186 -
 187
187 -
 188
188 -
189
-
190
-
191
-
192
-
193
-
194
-
195
-
196
-
197
-
198
-
199
-
200
-
201
-
202
-
203
-
204
-
205
-
206
-
207
-
208
-
209
-
210
-
211
-
212
-
213
-
214
-
215
-
216
-
217
-
218
-
219
-
220
-
221
-
222
-
223
-
224
-
225
-
226
-
227
-
228
 |
 |

PROXY STATEMENT
40
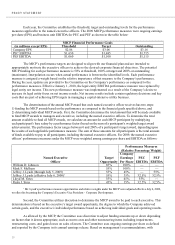
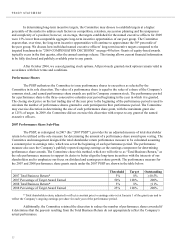
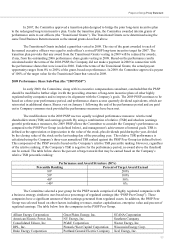
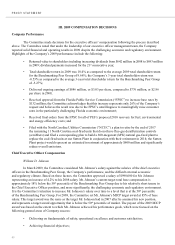
III. 2009 COMPENSATION DECISIONS
Company Performance
The Committee made decisions for the executive officers’ compensation following the process described
above. The Committee noted that under the leadership of our executive officer management team, the Company
reported solid financial and operating results in 2009 despite the challenging economic and regulatory environment.
Highlights of the Company’s 2009 performance include the following:
5HWXUQHGYDOXHWRVKDUeholders including increasing dividends from $642 million in 2008 to $693 million
in 2009; dividend payments increased for the 21st consecutive year;
7RWDOVKDUHKROGHUUHWXUQLQZDVDVFRPSDUHGWRWKHDYHUDJHWRWDOVKDUHKROGHUUHWXUQ
for the Benchmarking Peer Group of 9.66%; the Company’s 3-year total shareholder return was
-0.53% as compared to the average 3-year total shareholder return for the Benchmarking Peer Group
of -5.27%;
'HOLYHUHGRQJRLQJHDUQLQJVRIPLOOLRQRUSHUVKDUHFRPSDUHGWRPLOOLRQRU
per share in 2008;
5HFHLYHGDSSURYDOIURPWKH)ORULGD3XEOLF6HUYLFH&RPPLVVLRQ³)36&´WRLQFUHDVHEDVHUDWHVE\
$132 million; the Committee acknowledges that this increase represents only 26% of the Company’s
request and believes the result was due to the FPSC’s unwillingness to meaningfully raise consumer
rates in the particularly challenging Florida economic environment;
5HFHLYHGILQDORUGHUVIURPWKH)36&IRUDOORI3()¶VSURSRVHGUHFRYHU\IRUIXHOHQYLURQPHQWDO
and energy-efficiency costs; and
)LOHGZLWKWKH1RUWK&DUROLQD8WLOLWLHV&RPPLVVLRQ³1&8&´DSODQWRUHWLUHE\WKHHQGRI
the remaining 11 North Carolina coal-fired units that do not have flue-gas desulfurization controls
(scrubbers) and filed a corresponding plan to build a 600-megawatt (MW) natural gas-fired plant to
replace the coal-fired units at our Sutton Plant in conjunction with their retirement in 2014; the Sutton
Plant project would represent an estimated investment of approximately $600 million and significantly
reduce overall emissions.
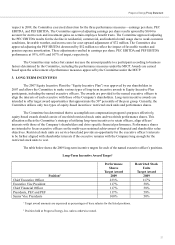
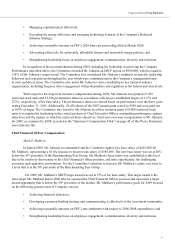
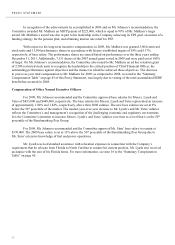
Chief Executive Officer Compensation
William D. Johnson
In March 2009, the Committee considered Mr. Johnson’s salary against the salaries of the chief executive
officers in the Benchmarking Peer Group, the Company’s performance, and the difficult external economic
and regulatory climate. Based on these factors, the Committee approved a salary of $990,000 for Mr. Johnson
representing an increase of 4.2% to his 2008 salary. Mr. Johnson’s current target total base compensation is
approximately 18% below the 50th percentile of the Benchmarking Peer Group due to his relatively short tenure in
the Chief Executive Officer position, and more significantly, the challenging economic and regulatory environment.
It is the Committee’s intention to increase Mr. Johnson’s salary over time to a level that is at the 50th percentile
of the Benchmarking Peer Group. For 2009, the Committee set Mr. Johnson’s MICP target award at 85% of base
salary. This target award was the same as the target Mr. Johnson had in 2007 after he assumed his new position,
and represents a target award opportunity that is below the 50th percentile of market. The payout of the 2009 MICP
award was based on the extent to which Mr. Johnson achieved his performance goals, which were focused on the
following general areas of Company success:
'HOLYHULQJRQIXQGDPHQWDOVRIVDIHW\RSHUDWLRQDOH[FHOOHQFHDQGFXVWRPHUVDWLVIDFWLRQ
$FKLHYLQJILQDQFLDOREMHFWLYHV