Seagate 2008 Annual Report Download - page 150
Download and view the complete annual report
Please find page 150 of the 2008 Seagate annual report below. You can navigate through the pages in the report by either clicking on the pages listed below, or by using the keyword search tool below to find specific information within the annual report.-
 1
1 -
2
-
3
-
4
-
5
-
6
-
7
-
8
-
9
-
10
-
11
-
12
-
13
-
14
-
15
-
16
-
17
-
18
-
19
-
20
-
21
-
22
-
23
-
24
-
25
-
26
-
27
-
28
-
29
-
30
-
31
-
32
-
33
-
34
-
35
-
36
-
37
-
38
-
39
-
40
-
41
-
42
-
43
-
44
-
45
-
46
-
47
-
48
-
49
-
50
-
51
-
52
-
53
-
54
-
55
-
56
-
57
-
58
-
59
-
60
-
61
-
62
-
63
-
64
-
65
-
66
-
67
-
68
-
69
-
70
-
71
-
72
-
73
-
74
-
75
-
76
-
77
-
78
-
79
-
80
-
81
-
82
-
83
-
84
-
85
-
86
-
87
-
88
-
89
-
90
-
91
-
92
-
93
-
94
-
95
-
96
-
97
-
98
-
99
-
100
-
101
-
102
-
103
-
104
-
105
-
106
-
107
-
108
-
109
-
110
-
111
-
112
-
113
-
114
-
115
-
116
-
117
-
118
-
119
-
120
-
121
-
122
-
123
-
124
-
125
-
126
-
127
-
128
-
129
-
130
-
131
-
132
-
133
-
134
-
135
-
136
-
137
-
138
-
139
-
 140
140 -
 141
141 -
 142
142 -
 143
143 -
 144
144 -
 145
145 -
 146
146 -
 147
147 -
 148
148 -
 149
149 -
 150
150 -
 151
151 -
 152
152 -
 153
153 -
 154
154 -
 155
155 -
 156
156 -
 157
157 -
 158
158 -
 159
159 -
 160
160 -
161
-
162
-
163
-
164
-
165
-
166
-
167
-
168
-
169
-
170
-
171
-
172
-
173
-
174
-
175
-
176
-
177
-
178
-
179
-
180
-
181
-
182
-
183
-
184
-
185
-
186
-
187
-
188
-
189
-
190
-
191
-
192
-
193
-
194
-
195
-
196
-
197
-
198
-
199
-
200
-
201
-
202
-
203
-
204
-
205
 |
 |

Table of Contents
SEAGATE TECHNOLOGY
NOTES TO CONSOLIDATED FINANCIAL STATEMENTS—(Continued)
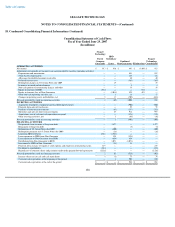
19. Supplementary Financial Data (Unaudited)
Quarterly Data
The Company operated and reported financial results based on a 14-
week quarter in its first quarter of fiscal year 2009 ending on the Friday
closest to September 30, 2008 and 13-week quarters which ended on the Friday closest to December 31, March 31, and June 30 for each of the
remaining quarters of fiscal year 2009. Certain prior quarter financial statement amounts affecting gross margin and income (loss) from
operations have been reclassified to conform to the current quarter presentation. These reclassifications, which were not material, did not impact
previously reported net income (loss).
The results for the first quarter of fiscal year 2009 include approximately $51 million in charges relating to restructuring activities and
$20 million in purchased intangibles amortization and other charges associated with acquisitions.
The results for the second quarter of fiscal year 2009 include approximately $2.3 billion in charges related to the impairment of goodwill
and other long-lived assets, a $271 million unfavorable adjustment to the valuation allowance related to the Company's deferred tax assets,
$94 million in restructuring and related accelerated depreciation charges, and $18 million in purchased intangibles amortization and other
charges associated with acquisitions.
The results for the third quarter of fiscal year 2009 include approximately $36 million in restructuring and related accelerated depreciation
charges and $18 million in purchased intangibles amortization and other charges associated with acquisitions.
The results for the fourth quarter of fiscal year 2009 include approximately $85 million in restructuring and related accelerated depreciation
charges and $21 million in purchased intangibles amortization and other charges associated with acquisitions.
148
Fiscal Year 2009 Quarters Ended
(Dollars in millions, except per share data)
October 3,
2008
January 2,
2009
April 3,
2009
July 3,
2009
Revenue
$
3,033
$
2,270
$
2,150
$
2,353
Gross margin
526
316
153
415
Income (loss) from operations
81
(2,443
)
(262
)
(11
)
Net income (loss)
60
(2,792
)
(273
)
(81
)
Net income (loss) per share:
Basic
$
0.12
$
(5.73
)
$
(0.56
)
$
(0.16
)
Diluted
0.12
(5.73
)
(0.56
)
(0.16
)