Seagate 2008 Annual Report Download - page 52
Download and view the complete annual report
Please find page 52 of the 2008 Seagate annual report below. You can navigate through the pages in the report by either clicking on the pages listed below, or by using the keyword search tool below to find specific information within the annual report.-
 1
1 -
2
-
3
-
4
-
5
-
6
-
7
-
8
-
9
-
10
-
11
-
12
-
13
-
14
-
15
-
16
-
17
-
18
-
19
-
20
-
21
-
22
-
23
-
24
-
25
-
26
-
27
-
28
-
29
-
30
-
31
-
32
-
33
-
34
-
35
-
36
-
37
-
38
-
39
-
40
-
41
-
 42
42 -
 43
43 -
 44
44 -
 45
45 -
 46
46 -
 47
47 -
 48
48 -
 49
49 -
 50
50 -
 51
51 -
 52
52 -
 53
53 -
 54
54 -
 55
55 -
 56
56 -
 57
57 -
 58
58 -
 59
59 -
 60
60 -
 61
61 -
 62
62 -
63
-
64
-
65
-
66
-
67
-
68
-
69
-
70
-
71
-
72
-
73
-
74
-
75
-
76
-
77
-
78
-
79
-
80
-
81
-
82
-
83
-
84
-
85
-
86
-
87
-
88
-
89
-
90
-
91
-
92
-
93
-
94
-
95
-
96
-
97
-
98
-
99
-
100
-
101
-
102
-
103
-
104
-
105
-
106
-
107
-
108
-
109
-
110
-
111
-
112
-
113
-
114
-
115
-
116
-
117
-
118
-
119
-
120
-
121
-
122
-
123
-
124
-
125
-
126
-
127
-
128
-
129
-
130
-
131
-
132
-
133
-
134
-
135
-
136
-
137
-
138
-
139
-
140
-
141
-
142
-
143
-
144
-
145
-
146
-
147
-
148
-
149
-
150
-
151
-
152
-
153
-
154
-
155
-
156
-
157
-
158
-
159
-
160
-
161
-
162
-
163
-
164
-
165
-
166
-
167
-
168
-
169
-
170
-
171
-
172
-
173
-
174
-
175
-
176
-
177
-
178
-
179
-
180
-
181
-
182
-
183
-
184
-
185
-
186
-
187
-
188
-
189
-
190
-
191
-
192
-
193
-
194
-
195
-
196
-
197
-
198
-
199
-
200
-
201
-
202
-
203
-
204
-
205
 |
 |

Table of Contents
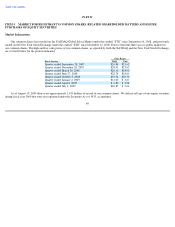
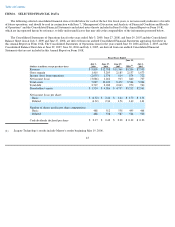
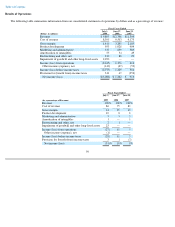
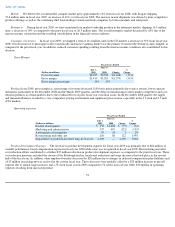
Results of Operations
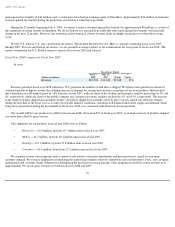
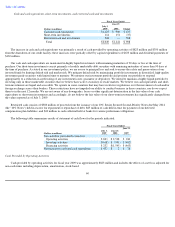
The following table summarizes information from our consolidated statements of operations by dollars and as a percentage of revenue:
50
Fiscal Years Ended
(Dollars in millions)
July 3,
2009
June 27,
2008
June 29,
2007
Revenue
$
9,805
$
12,708
$
11,360
Cost of revenue
8,395
9,503
9,175
Gross margin
1,410
3,205
2,185
Product development
953
1,028
904
Marketing and administrative
537
659
589
Amortization of intangibles
55
54
49
Restructuring and other, net
210
88
29
Impairment of goodwill and other long
-
lived assets
2,290
—
—
Income (loss) from operations
(2,635
)
1,376
614
Other income (expense), net
(140
)
(47
)
(53
)
Income (loss) before income taxes
(2,775
)
1,329
561
Provision for (benefit from) income taxes
311
67
(352
)
Net income (loss)
$
(3,086
)
$
1,262
$
913
Fiscal Years Ended
(As a percentage of Revenue)
July 3,
2009
June 27,
2008
June 29,
2007
Revenue
100
%
100
%
100
%
Cost of revenue
86
75
81
Gross margin
14
25
19
Product development
10
8
8
Marketing and administrative
5
5
5
Amortization of intangibles
1
—
1
Restructuring and other, net
2
1
—
Impairment of goodwill and other long
-
lived assets
23
—
—
Income (loss) from operations
(27
)
11
5
Other income (expense), net
(1
)
—
—
Income (loss) before income taxes
(28
)
11
5
Provision for (benefit from) income taxes
3
1
(3
)
Net income (loss)
(31
)%
10
%
8
%