Seagate 2008 Annual Report Download - page 81
Download and view the complete annual report
Please find page 81 of the 2008 Seagate annual report below. You can navigate through the pages in the report by either clicking on the pages listed below, or by using the keyword search tool below to find specific information within the annual report.-
 1
1 -
2
-
3
-
4
-
5
-
6
-
7
-
8
-
9
-
10
-
11
-
12
-
13
-
14
-
15
-
16
-
17
-
18
-
19
-
20
-
21
-
22
-
23
-
24
-
25
-
26
-
27
-
28
-
29
-
30
-
31
-
32
-
33
-
34
-
35
-
36
-
37
-
38
-
39
-
40
-
41
-
42
-
43
-
44
-
45
-
46
-
47
-
48
-
49
-
50
-
51
-
52
-
53
-
54
-
55
-
56
-
57
-
58
-
59
-
60
-
61
-
62
-
63
-
64
-
65
-
66
-
67
-
68
-
69
-
70
-
 71
71 -
 72
72 -
 73
73 -
 74
74 -
 75
75 -
 76
76 -
 77
77 -
 78
78 -
 79
79 -
 80
80 -
 81
81 -
 82
82 -
 83
83 -
 84
84 -
 85
85 -
 86
86 -
 87
87 -
 88
88 -
 89
89 -
 90
90 -
 91
91 -
92
-
93
-
94
-
95
-
96
-
97
-
98
-
99
-
100
-
101
-
102
-
103
-
104
-
105
-
106
-
107
-
108
-
109
-
110
-
111
-
112
-
113
-
114
-
115
-
116
-
117
-
118
-
119
-
120
-
121
-
122
-
123
-
124
-
125
-
126
-
127
-
128
-
129
-
130
-
131
-
132
-
133
-
134
-
135
-
136
-
137
-
138
-
139
-
140
-
141
-
142
-
143
-
144
-
145
-
146
-
147
-
148
-
149
-
150
-
151
-
152
-
153
-
154
-
155
-
156
-
157
-
158
-
159
-
160
-
161
-
162
-
163
-
164
-
165
-
166
-
167
-
168
-
169
-
170
-
171
-
172
-
173
-
174
-
175
-
176
-
177
-
178
-
179
-
180
-
181
-
182
-
183
-
184
-
185
-
186
-
187
-
188
-
189
-
190
-
191
-
192
-
193
-
194
-
195
-
196
-
197
-
198
-
199
-
200
-
201
-
202
-
203
-
204
-
205
 |
 |

Table of Contents
SEAGATE TECHNOLOGY
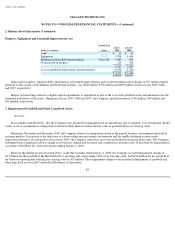
NOTES TO CONSOLIDATED FINANCIAL STATEMENTS—(Continued)
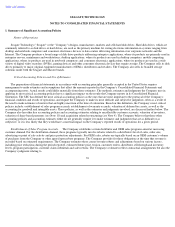
1. Summary of Significant Accounting Policies (Continued)
Company assesses the recoverability of an asset group by determining if the carrying value of the asset group exceeds the sum of the projected
undiscounted cash flows expected to result from the use and eventual disposition of the assets over the remaining economic life of the primary
asset in the asset group. If the recoverability test indicates that the carrying value of the asset group is not recoverable, the Company will
estimate the fair value of the asset group using the same approaches indicated above for SFAS No. 142 step two and compare it to its carrying
value. The excess of the carrying value over the fair value is allocated pro rata to derive the adjusted carrying value of assets in the asset group.
The adjusted carrying value of each asset in the asset group is not reduced below its fair value.
See Note 3 for additional disclosure of these analyses, including the total impairment charges recorded during fiscal year 2009.
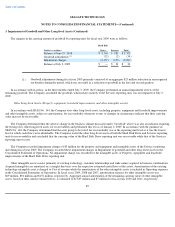
The process of evaluating the potential impairment of goodwill or other long-lived assets is subjective and requires significant judgment on
matters such as, but not limited to, the reporting unit at which goodwill should be measured for impairment and the asset group to be tested for
recoverability. The Company is also required to make estimates that may significantly impact the outcome of the analyses. Such estimates
include, but are not limited to, future operating performance and cash flows, cost of capital, terminal values, control premiums and remaining
economic lives of assets.
Basis of Presentation and Consolidation
The Consolidated Financial Statements include the accounts of the Company and all its wholly-owned subsidiaries, after elimination of
intercompany transactions and balances. The Consolidated Financial Statements reflect, in the opinion of management, all material adjustments
necessary to present fairly the consolidated financial position, results of operations, cash flows and shareholders' equity for the periods presented.
The Company operates and reports financial results on a fiscal year of 52 or 53 weeks ending on the Friday closest to June 30. Accordingly,
fiscal year 2009 comprised 53 weeks and ended on July 3, 2009. Fiscal years 2008 and 2007 comprised 52 weeks and ended on June 27, 2008
and June 29, 2007, respectively. All references to years in these Notes to Consolidated Financial Statements represent fiscal years unless
otherwise noted. Fiscal year 2010 will be 52 weeks and will end on July 2, 2010.
Cash, Cash Equivalents and Short-Term Investments. The Company considers all highly liquid investments with a remaining maturity of
90 days or less at the time of purchase to be cash equivalents. Cash equivalents are carried at cost, which approximates fair value. The
Company's short-term investments are primarily comprised of readily marketable debt securities with remaining maturities of more than 90 days
at the time of purchase. The Company has classified its entire investment portfolio as available-for-sale. Available-for-sale securities are
classified as cash equivalents or short-term investments and are stated at fair value with unrealized gains and losses included in Accumulated
other comprehensive income (loss), which is a component of shareholders' equity. The amortized cost of debt securities is adjusted for
amortization of premiums and accretion of discounts to maturity. Such amortization and accretion are included in interest income. Realized gains
and losses are included in other income (expense). The cost of securities sold is based on the specific identification method.
Restricted Cash and Investments. Restricted cash and investments represents cash and investments that are restricted as to withdrawal or
use for other than current operations (see Note 2).
79