AT&T Wireless 2007 Annual Report Download - page 37
Download and view the complete annual report
Please find page 37 of the 2007 AT&T Wireless annual report below. You can navigate through the pages in the report by either clicking on the pages listed below, or by using the keyword search tool below to find specific information within the annual report.-
 1
1 -
2
-
3
-
4
-
5
-
6
-
7
-
8
-
9
-
10
-
11
-
12
-
13
-
14
-
15
-
16
-
17
-
18
-
19
-
20
-
21
-
22
-
23
-
24
-
25
-
26
-
 27
27 -
 28
28 -
 29
29 -
 30
30 -
 31
31 -
 32
32 -
 33
33 -
 34
34 -
 35
35 -
 36
36 -
 37
37 -
 38
38 -
 39
39 -
 40
40 -
 41
41 -
 42
42 -
 43
43 -
 44
44 -
 45
45 -
 46
46 -
 47
47 -
48
-
49
-
50
-
51
-
52
-
53
-
54
-
55
-
56
-
57
-
58
-
59
-
60
-
61
-
62
-
63
-
64
-
65
-
66
-
67
-
68
-
69
-
70
-
71
-
72
-
73
-
74
-
75
-
76
-
77
-
78
-
79
-
80
-
81
-
82
-
83
-
84
-
85
-
86
-
87
-
88
 |
 |

2007 AT&T Annual Report
| 35
Partially offsetting these increases, selling, general and
administrative expenses in 2007 decreased due to:
• Lower net pension and postretirement cost of $243,
primarily due to changes in our actuarial assumptions,
including the increase of our discount rate from 5.75% to
6.00% (a decrease to expense) and favorable investment
returns on plan assets resulting in a decrease in the
recognition of net losses from prior years.
• Lower employee levels, which decreased expenses,
primarily salary and wages, by $222.
• Lower nonemployee-related expenses, such as contract
services, agent commissions and materials and supplies
costs, of $148.
In addition to the impact of the ATTC acquisition, selling,
general and administrative expenses in 2006 also increased
due to the following:
• Other wireline segment costs of $809 primarily due to
advertising costs related to promotion of the AT&T brand
name. In addition, other advertising expenses increased
$117.
• Higher nonemployee-related expenses, such as contract
services, agent commissions and materials and supplies
costs of $103.
• Higher benefit expenses, consisting primarily of our
combined net pension and postretirement cost, increased
expense $73, primarily due to changes in our actuarial
assumptions, which included the reduction of our
discount rate from 6.00% to 5.75% (which increases
expense) and net losses on plan assets in prior years.
Partially offsetting these increases, selling, general and
administrative expenses in 2006 decreased due to:
• ATTC merger-related asset impairment charges of $349
and merger-related severance expense of $107 during
2005, which resulted in lower expenses in 2006.
• Lower employee levels, which decreased expenses,
primarily salary and wages, by $239.
• A charge of $236 in 2005 to terminate existing
agreements with WilTel Communications due to
our acquisition of ATTC.
• A change made during 2006 in our policy regarding
the timing for earning vacation days, which decreased
expenses $96.
• Our provision for uncollectible accounts decreased
$87, as we experienced fewer losses from our retail
customers and a decrease in bankruptcy filings by our
wholesale customers.
Depreciation and amortization expenses increased
$3,735, or 38.6%, in 2007 and $2,250, or 30.3%, in 2006
primarily due to higher depreciable and amortizable asset
bases as a result of the BellSouth acquisition in 2006 and
the ATTC acquisition in 2005.
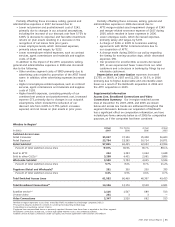
Supplemental Information
Access Line, Broadband Connections and Video
Connections Summary Our in-region switched access
lines at December 31, 2007, 2006, and 2005 are shown
below and access line trends are addressed throughout this
segment discussion. Because our acquisition of BellSouth
has a significant effect on comparative information, we have
included pro-forma amounts below as of 2006 for comparative
purposes, as if the companies had been combined.
Wireline In-Region1
Actual Pro Forma Actual Actual
(in 000s) 2007 2006 2006 2005
Switched Access Lines
Retail Consumer 35,047 37,120 25,308 26,683
Retail Business2 22,754 23,295 16,714 16,871
Retail Subtotal2 57,801 60,415 42,022 43,554
Percent of total switched access lines 93.9% 90.9% 90.7% 88.1%
Sold to ATTC 242 1,293 1,044 1,638
Sold to other CLECs2,3 3,288 4,431 2,991 3,886
Wholesale Subtotal2 3,530 5,724 4,035 5,524
Percent of total switched access lines 5.7% 8.6% 8.7% 11.2%
Payphone (Retail and Wholesale)4 251 330 250 335
Percent of total switched access lines 0.4% 0.5% 0.6% 0.7%
Total Switched Access Lines 61,582 66,469 46,307 49,413
Total Broadband Connections2,5 14,156 12,170 8,538 6,921
Satellite service2,6 2,116 1,507 689 513
U-verse video 231 3 3 —
Video Connections 2,347 1,510 692 513
1Wireline in-region represents access lines served by AT&T’s incumbent local exchange companies (ILECs).
2Prior period amounts restated to conform to current period reporting methodology.
3Competitive local exchange carriers (CLECs).
4Payphone lines are presented above as previously reported. Revenue from these lines is reported in the Other segment.
5Broadband connections include DSL, U-verse high-speed Internet access and satellite broadband.
6Satellite service includes connections under our agency and resale agreements with EchoStar and DIRECTV.