AT&T Wireless 2007 Annual Report Download - page 39
Download and view the complete annual report
Please find page 39 of the 2007 AT&T Wireless annual report below. You can navigate through the pages in the report by either clicking on the pages listed below, or by using the keyword search tool below to find specific information within the annual report.-
 1
1 -
2
-
3
-
4
-
5
-
6
-
7
-
8
-
9
-
10
-
11
-
12
-
13
-
14
-
15
-
16
-
17
-
18
-
19
-
20
-
21
-
22
-
23
-
24
-
25
-
26
-
27
-
28
-
 29
29 -
 30
30 -
 31
31 -
 32
32 -
 33
33 -
 34
34 -
 35
35 -
 36
36 -
 37
37 -
 38
38 -
 39
39 -
 40
40 -
 41
41 -
 42
42 -
 43
43 -
 44
44 -
 45
45 -
 46
46 -
 47
47 -
 48
48 -
 49
49 -
50
-
51
-
52
-
53
-
54
-
55
-
56
-
57
-
58
-
59
-
60
-
61
-
62
-
63
-
64
-
65
-
66
-
67
-
68
-
69
-
70
-
71
-
72
-
73
-
74
-
75
-
76
-
77
-
78
-
79
-
80
-
81
-
82
-
83
-
84
-
85
-
86
-
87
-
88
 |
 |

2007 AT&T Annual Report
| 37
Our other segment operating results consist primarily of Sterling,
customer information services, corporate and other operations.
Sterling provides business-integration software and services.
In late 2007, we announced our intention to cease our retail
payphone operations by the end of 2008, which is reflected
in the operating revenues and expenses discussion below.
Operating revenues increased $356, or 19.0%, in 2007 and
$147, or 8.5%, in 2006. The increase in 2007 was primarily due
to the addition of BellSouth’s other operations and increased
operating revenue at Sterling, partially offset by decreased
revenues from our retail payphone operations. The increase in
2006 was primarily due to increased intercompany revenue
from our captive insurance company (shown as intersegment
revenue in Note 4) and improved operating revenue at Sterling,
partially offset by a decrease in revenue as a result of the sale
of our paging subsidiary in November 2005.
Operating expenses increased $342, or 23.0%, in 2007 and
$237, or 19.0%, in 2006. The increase in 2007 was primarily due
to the addition of BellSouth’s other operations and increased
operating expenses at Sterling, partially offset by decreased
expenses from our retail payphone operations. The increase in
2006 was primarily due to increased operating expenses at
Sterling and at our captive insurance company, partially offset
by management fees paid in 2005 that did not recur in 2006.
Prior to the December 29, 2006 close of the BellSouth
acquisition, our other segment included our 60% proportion-
ate share of AT&T Mobility results as equity in net income
of affiliates. As a result of the BellSouth acquisition, we own
100% of AT&T Mobility and its results for the final two days
of 2006 and for the year 2007 have been excluded from
equity in net income of affiliates in this segment and in
our consolidated statements of income.
Our other segment also includes our equity investments in
international companies, the income from which we report as
equity in net income of affiliates. Our earnings from foreign
affiliates are sensitive to exchange-rate changes in the value
of the respective local currencies. Our foreign investments are
recorded under GAAP, which include adjustments for the
purchase method of accounting and exclude certain adjustments
required for local reporting in specific countries. Our equity in
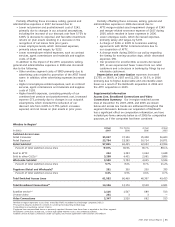
net income of affiliates by major investment is listed below:
2007 2006 2005
América Móvil $381 $ 274 $198
Telmex 265 222 212
AT&T Mobility — 1,508 200
Other 30 16 19
Other Segment Equity in
Net Income of Affiliates $676 $2,020 $629
Equity in net income of affiliates decreased $1,344 in
2007 primarily due to a change in accounting for AT&T
Mobility, the results of which are no longer included in
equity in net income of affiliates in 2007 due to the
acquisition of BellSouth. This decrease was partially offset
by an increase of $150 from América Móvil and Telmex
primarily due to improved operating results. Equity in net
income increased $1,391 in 2006, primarily due to the
improved operating results at AT&T Mobility.
OPERATING ENVIRONMENT AND TRENDS OF THE BUSINESS
2008 Revenue Trends We expect continued expansion of
our operating revenues in 2008, reflecting continuing growth
in our wireless and broadband/data services. We expect our
primary driver of growth to be wireless and that all our major
customer categories will continue to increase their use of
Internet-based broadband/data services. For our enterprise
(largest) business customers, we achieved positive growth in
recurring service revenues beginning in the third quarter of
2007 and expect total enterprise revenues to grow throughout
2008. Revenue growth will also reflect the increased
information and technology services to be provided for
under our agreements with IBM. We also expect continued
revenue growth from our small and medium business
customers. We expect modest growth in our consumer wireline
revenues with continuing declines in traditional access lines
being offset by growth in broadband and video services.
We expect solid growth in broadband revenues with
improvement in ARPU as customers continue to choose
higher-speed services. We expect to continue to expand
our U-verse service offerings with the goal of exceeding
one million subscribers in service by the end of 2008.
2008 Expense Trends Acquisition and related merger
costs and the costs involved in providing services under
the IBM agreements will adversely affect expenses in 2008.
We expect that our operating income margin, adjusted to
exclude these costs, will expand in 2008 due primarily to
expected improvement in our revenues and continued
cost-control measures. In particular, we expect to continue
net workforce reductions and other previously identified
merger synergies and to begin new cost-control initiatives
in network operations, information technology and customer
care. Expenses related to growth initiatives (see “Expected
Growth Areas”) will apply some pressure to our operating
income margin.
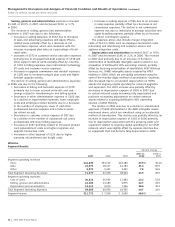
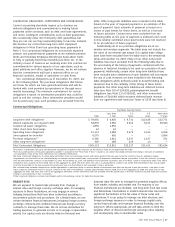
Other
Segment Results
Percent Change
2007 vs. 2006 vs.
2007 2006 2005 2006 2005
Total Segment Operating Revenues $2,234 $1,878 $1,731 19.0% 8.5%
Total Segment Operating Expenses 1,827 1,485 1,248 23.0 19.0
Segment Operating Income 407 393 483 3.6 (18.6)
Equity in Net Income of Affiliates 676 2,020 629 (66.5) —
Segment Income $1,083 $2,413 $1,112 (55.1)% —