America Online 2014 Annual Report Download - page 117
Download and view the complete annual report
Please find page 117 of the 2014 America Online annual report below. You can navigate through the pages in the report by either clicking on the pages listed below, or by using the keyword search tool below to find specific information within the annual report.-
 1
1 -
2
-
3
-
4
-
5
-
6
-
7
-
8
-
9
-
10
-
11
-
12
-
13
-
14
-
15
-
16
-
17
-
18
-
19
-
20
-
21
-
22
-
23
-
24
-
25
-
26
-
27
-
28
-
29
-
30
-
31
-
32
-
33
-
34
-
35
-
36
-
37
-
38
-
39
-
40
-
41
-
42
-
43
-
44
-
45
-
46
-
47
-
48
-
49
-
50
-
51
-
52
-
53
-
54
-
55
-
56
-
57
-
58
-
59
-
60
-
61
-
62
-
63
-
64
-
65
-
66
-
67
-
68
-
69
-
70
-
71
-
72
-
73
-
74
-
75
-
76
-
77
-
78
-
79
-
80
-
81
-
82
-
83
-
84
-
85
-
86
-
87
-
88
-
89
-
90
-
91
-
92
-
93
-
94
-
95
-
96
-
97
-
98
-
99
-
100
-
101
-
102
-
103
-
104
-
105
-
106
-
 107
107 -
 108
108 -
 109
109 -
 110
110 -
 111
111 -
 112
112 -
 113
113 -
 114
114 -
 115
115 -
 116
116 -
 117
117 -
 118
118 -
 119
119 -
 120
120 -
 121
121 -
 122
122 -
 123
123 -
 124
124 -
 125
125 -
 126
126 -
 127
127 -
128
-
129
-
130
-
131
-
132
-
133
-
134
-
135
-
136
-
137
-
138
-
139
-
140
-
141
-
142
-
143
-
144
-
145
-
146
-
147
-
148
-
149
-
150
-
151
-
152
-
153
-
154
-
155
-
156
 |
 |

AOL INC.
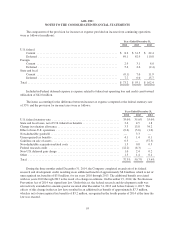
NOTES TO THE CONSOLIDATED FINANCIAL STATEMENTS
AOL Stock Options
The assumptions presented in the table below represent the weighted-average value of the applicable
assumption used to value AOL stock options at their grant date for stock options granted during the periods
presented:
Years Ended December 31,
2014 2013 2012
Expected volatility ........................................ 38.6% 37.5% 39.0%
Expected term to exercise from grant date ..................... 4.87 years 5.01 years 5.10 years
Risk-free rate ............................................ 1.5% 1.0% 1.1%
Expected dividend yield ................................... 0.0% 0.0% 0.0%
The volatility assumptions were determined based on a blend of AOL’s implied volatility and the historical
and implied volatilities of a comparable peer group of publicly traded companies. The expected term, which
represents the period of time that options granted are expected to be outstanding, is estimated based on the
historical exercise experience and termination behaviors of the individuals that hold options to acquire AOL
common stock. The risk-free rate assumed in valuing the options is based on the U.S. Treasury yield curve in
effect at the time of grant for the expected term of the option. As the Company does not currently intend to pay
dividends, the expected dividend yield is zero for all AOL equity awards granted.
The following table summarizes AOL stock option activity for the year ended December 31, 2014:
Number of
Options
(in millions)
Weighted-
Average
Exercise Price
Weighted-Average
Remaining
Contractual Life
(in years)
Aggregate
Intrinsic Value
(in thousands)
Options
Outstanding at December 31, 2013 ......... 6.5 $ 21.76 6.9 years $ 161,134
Exercised ............................. (0.8) $ 19.97 $ 17,587
Granted ............................... 0.4 $ 42.09
Forfeited .............................. (0.3) $ 29.36
Expired ............................... — $ —
Outstanding at December 31, 2014 ......... 5.8 $ 22.98 6.0 years $ 134,355
Exercisable at December 31, 2013 .......... 4.1 $ 18.92 6.2 years $ 114,065
Exercisable at December 31, 2014 .......... 4.8 $ 20.58 5.5 years $ 121,631
As of December 31, 2014, 18.5 million shares of AOL common stock were available for future grants of
stock options. As of December 31, 2014, there was $10.8 million of unrecognized compensation cost related to
outstanding employee stock options expected to vest. The Company expects to recognize this amount over a
weighted-average period of 2.0 years. To the extent the actual forfeiture rate is different from what the Company
has estimated, equity-based compensation expense related to these awards will be different from the Company’s
expectations.
The weighted-average grant date fair value of an AOL stock option granted during the years ended
December 31, 2014, 2013 and 2012 was $14.97, $12.96 and $6.93, respectively. The intrinsic value of stock
options exercised for the years ended December 31, 2014, 2013 and 2012 was $17.6 million, $43.1 million and
$19.3 million, respectively.
101