America Online 2014 Annual Report Download - page 118
Download and view the complete annual report
Please find page 118 of the 2014 America Online annual report below. You can navigate through the pages in the report by either clicking on the pages listed below, or by using the keyword search tool below to find specific information within the annual report.-
 1
1 -
2
-
3
-
4
-
5
-
6
-
7
-
8
-
9
-
10
-
11
-
12
-
13
-
14
-
15
-
16
-
17
-
18
-
19
-
20
-
21
-
22
-
23
-
24
-
25
-
26
-
27
-
28
-
29
-
30
-
31
-
32
-
33
-
34
-
35
-
36
-
37
-
38
-
39
-
40
-
41
-
42
-
43
-
44
-
45
-
46
-
47
-
48
-
49
-
50
-
51
-
52
-
53
-
54
-
55
-
56
-
57
-
58
-
59
-
60
-
61
-
62
-
63
-
64
-
65
-
66
-
67
-
68
-
69
-
70
-
71
-
72
-
73
-
74
-
75
-
76
-
77
-
78
-
79
-
80
-
81
-
82
-
83
-
84
-
85
-
86
-
87
-
88
-
89
-
90
-
91
-
92
-
93
-
94
-
95
-
96
-
97
-
98
-
99
-
100
-
101
-
102
-
103
-
104
-
105
-
106
-
107
-
 108
108 -
 109
109 -
 110
110 -
 111
111 -
 112
112 -
 113
113 -
 114
114 -
 115
115 -
 116
116 -
 117
117 -
 118
118 -
 119
119 -
 120
120 -
 121
121 -
 122
122 -
 123
123 -
 124
124 -
 125
125 -
 126
126 -
 127
127 -
 128
128 -
129
-
130
-
131
-
132
-
133
-
134
-
135
-
136
-
137
-
138
-
139
-
140
-
141
-
142
-
143
-
144
-
145
-
146
-
147
-
148
-
149
-
150
-
151
-
152
-
153
-
154
-
155
-
156
 |
 |

AOL INC.
NOTES TO THE CONSOLIDATED FINANCIAL STATEMENTS
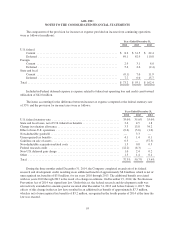
AOL Restricted Stock Units and Performance Stock Units
The following table summarizes information about unvested AOL RSUs, RSAs and PSUs for the year ended
December 31, 2014:
Number of
RSUs, RSAs
and PSUs
(in millions)
Weighted-
Average Grant
Date Fair Value
Unvested at December 31, 2013 .......................................... 3.5 $ 35.1
Vested .............................................................. (1.4) $ 31.0
Granted ............................................................. 2.5 $ 42.8
Forfeited ............................................................ (0.9) $ 37.3
Unvested at December 31, 2014 .......................................... 3.7 $ 40.9
At December 31, 2014, the intrinsic value of unvested AOL RSUs, RSAs and PSUs was $169.4 million. As
of December 31, 2014, there was $80.3 million of unrecognized compensation cost related to outstanding RSUs,
RSAs and PSUs expected to vest.The Company expects to recognize this amount over a weighted-average period
of 2.0 years. To the extent the actual forfeiture rate is different from what the Company has estimated, equity-
based compensation expense related to these awards will be different from the Company’s expectations. Total
fair value of shares vested during the years ended December 31, 2014, 2013 and 2012 was $43.4 million, $28.2
million and $15.5 million, respectively.
NOTE 9—RESTRUCTURING COSTS
As part of the Company’s continuing effort to reduce its expenses and invest in areas of strategic focus, the
Company incurred restructuring costs of $22.0 million, $41.3 million and $10.1 million for the years ended
December 31, 2014, 2013 and 2012, respectively. These restructuring costs were primarily related to involuntary
employee terminations. The 2013 restructuring costs primarily related to the Company’s efforts to align its
organizational structure with its strategy, including the restructuring of its Patch operations.
A summary of AOL’s restructuring activity for the years ended December 31, 2014, 2013 and 2012 is as
follows (in millions):
Employee
Terminations
Other Exit
Costs Total
Liability at December 31, 2011 ................................... $ 5.6 $ 7.1 $ 12.7
2012 restructuring expense ....................................... 9.0 1.1 10.1
Foreign currency translation and other adjustments .................... 0.8 0.2 1.0
Cash paid .................................................... (14.0) (5.8) (19.8)
Liability at December 31, 2012 ................................... 1.4 2.6 4.0
2013 restructuring expense ....................................... 41.3 — 41.3
Foreign currency translation and other adjustments .................... (1.3) (0.1) (1.4)
Cash paid .................................................... (25.7) (1.7) (27.4)
Liability at December 31, 2013 ................................... 15.7 0.8 16.5
2014 Restructuring expense ...................................... 18.3 3.7 22.0
Foreign currency translation and other adjustments .................... (1.4) (1.0) (2.4)
Cash paid .................................................... (28.4) (1.8) (30.2)
Liability at December 31, 2014 ................................... $ 4.2 $ 1.7 $ 5.9
102