American Airlines 2004 Annual Report Download - page 30
Download and view the complete annual report
Please find page 30 of the 2004 American Airlines annual report below. You can navigate through the pages in the report by either clicking on the pages listed below, or by using the keyword search tool below to find specific information within the annual report.-
 1
1 -
2
-
3
-
4
-
5
-
6
-
7
-
8
-
9
-
10
-
11
-
12
-
13
-
14
-
15
-
16
-
17
-
18
-
19
-
 20
20 -
 21
21 -
 22
22 -
 23
23 -
 24
24 -
 25
25 -
 26
26 -
 27
27 -
 28
28 -
 29
29 -
 30
30 -
 31
31 -
 32
32 -
 33
33 -
 34
34 -
 35
35 -
 36
36 -
 37
37 -
 38
38 -
 39
39 -
 40
40 -
41
-
42
-
43
-
44
-
45
-
46
-
47
-
48
-
49
-
50
-
51
-
52
-
53
-
54
-
55
-
56
-
57
-
58
-
59
-
60
-
61
-
62
-
63
-
64
-
65
-
66
-
67
-
68
-
69
-
70
-
71
-
72
-
73
-
74
-
75
-
76
-
77
-
78
-
79
-
80
-
81
-
82
-
83
-
84
-
85
-
86
-
87
-
88
-
89
-
90
-
91
-
92
-
93
-
94
-
95
-
96
-
97
-
98
-
99
-
100
-
101
-
102
-
103
-
104
-
105
-
106
 |
 |

27
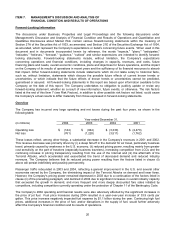
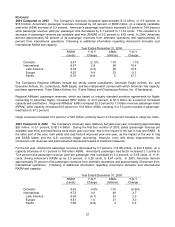
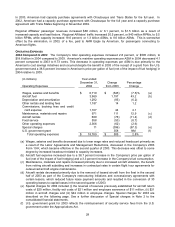
REVENUES
2004 Compared to 2003 The Company’s revenues increased approximately $1.2 billion, or 6.9 percent, to
$18.6 billion. American’s passenger revenues increased by 4.8 percent, or $689 million, on a capacity (available
seat mile) (ASM) increase of 5.3 percent. American’s passenger load factor increased 2.0 points to 74.8 percent
while passenger revenue yield per passenger mile decreased by 3.1 percent to 11.54 cents. This resulted in a
decrease in passenger revenue per available seat mile (RASM) of 0.5 percent to 8.63 cents. In 2004, American
derived approximately 66 percent of its passenger revenues from domestic operations and approximately 34
percent from international operations. Following is additional information regarding American’s domestic and
international RASM and capacity:
Year Ended December 31, 2004
RASM
(cents)
Y-O-Y
Change
ASMs
(billions)
Y-O-Y
Change
Domestic 8.47 (2.1)% 118 1.1%
International 8.97 2.8 56 15.4
Latin America 8.78 (3.3) 28 18.6
Europe 9.25 8.4 23 9.1
Pacific 8.79 14.9 5 27.7
The Company’s Regional Affiliates include two wholly owned subsidiaries, American Eagle Airlines, Inc. and
Executive Airlines, Inc. (collectively, AMR Eagle), and two independent carriers with which American has capacity
purchase agreements, Trans States Airlines, Inc. (Trans States) and Chautauqua Airlines, Inc. (Chautauqua).
Regional Affiliates’ passenger revenues, which are based on industry standard proration agreements for flights
connecting to American flights, increased $357 million, or 23.5 percent, to $1.9 billion as a result of increased
capacity and load factors. Regional Affiliates’ traffic increased 32.0 percent to 7.3 billion revenue passenger miles
(RPMs), while capacity increased 26.0 percent to 10.8 billion ASMs, resulting in a 3.0 point increase in passenger
load factor to 67.2 percent.
Cargo revenues increased 12.0 percent, or $67 million, primarily due to a 10.2 percent increase in cargo ton miles.
2003 Compared to 2002 The Company’s revenues were relatively flat year-over-year, increasing approximately
$20 million, or 0.1 percent, to $17.4 billion. During the first four months of 2003, yields (passenger revenue per
available seat mile) and load factors were down year-over-year, due to the impact of the war in Iraq and SARS. In
the latter part of the year, both yields and load factors improved year-over-year, as the impact of the war in Iraq
and SARS faded, and the U.S. economy began recovering. However, even with those improvements, the
Company’s unit revenues and yield remained depressed relative to historical measures.
For the full year, American's passenger revenues decreased by 0.7 percent, or $108 million, to $14.3 billion, on a
capacity decrease of 4.1 percent to 165 billion ASMs. American’s passenger load factor increased 2.1 points to
72.8 percent and passenger revenue yield per passenger mile increased by 0.4 percent, or 0.05 cents, to 11.91
cents, driving American’s RASM up by 3.3 percent, or 0.28 cents, to 8.67 cents. In 2003, American derived
approximately 70 percent of its passenger revenues from domestic operations and approximately 30 percent from
international operations. Following is additional information regarding American’s domestic and international
RASM and capacity:
Year Ended December 31, 2003
RASM
(cents)
Y-O-Y
Change
ASMs
(billions)
Y-O-Y
Change
Domestic 8.65 4.8% 116 (6.6)%
International 8.72 0.0 49 2.7
Latin America 9.08 (0.1) 24 2.0
Europe 8.53 1.6 21 3.0
Pacific 7.66 (6.8) 4 5.3