American Airlines 2004 Annual Report Download - page 79
Download and view the complete annual report
Please find page 79 of the 2004 American Airlines annual report below. You can navigate through the pages in the report by either clicking on the pages listed below, or by using the keyword search tool below to find specific information within the annual report.-
 1
1 -
2
-
3
-
4
-
5
-
6
-
7
-
8
-
9
-
10
-
11
-
12
-
13
-
14
-
15
-
16
-
17
-
18
-
19
-
20
-
21
-
22
-
23
-
24
-
25
-
26
-
27
-
28
-
29
-
30
-
31
-
32
-
33
-
34
-
35
-
36
-
37
-
38
-
39
-
40
-
41
-
42
-
43
-
44
-
45
-
46
-
47
-
48
-
49
-
50
-
51
-
52
-
53
-
54
-
55
-
56
-
57
-
58
-
59
-
60
-
61
-
62
-
63
-
64
-
65
-
66
-
67
-
68
-
 69
69 -
 70
70 -
 71
71 -
 72
72 -
 73
73 -
 74
74 -
 75
75 -
 76
76 -
 77
77 -
 78
78 -
 79
79 -
 80
80 -
 81
81 -
 82
82 -
 83
83 -
 84
84 -
 85
85 -
 86
86 -
 87
87 -
 88
88 -
 89
89 -
90
-
91
-
92
-
93
-
94
-
95
-
96
-
97
-
98
-
99
-
100
-
101
-
102
-
103
-
104
-
105
-
106
 |
 |

76
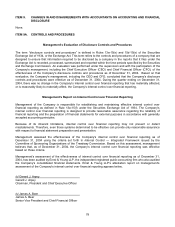
14. Segment Reporting (Continued)
Revenues from other segments are below the quantitative threshold for determining reportable segments and
consist primarily of revenues from AMR Investment Services, Inc. and Americas Ground Services, Inc. The
difference between the financial information of the Company’s one reportable segment and the financial
information included in the accompanying consolidated statements of operations and balance sheets as a result of
these entities is not material.
The Company’s operating revenues by geographic region are summarized below (in millions):
Year Ended December 31,
2004 2003 2002
Domestic $ 12,192 $ 12,687 $ 12,556
Latin America 3,115 2,477 2,530
Europe 2,678 1,980 1,921
Pacific 660 296 413
Total consolidated revenues $ 18,645 $ 17,440 $ 17,420
The Company attributes operating revenues by geographic region based upon the origin and destination of each
flight segment. The Company’s tangible assets consist primarily of flight equipment, which is mobile across
geographic markets and, therefore, has not been allocated.
15. Quarterly Financial Data (Unaudited)
Unaudited summarized financial data by quarter for 2004 and 2003 (in millions, except per share amounts):
First
Quarter
Second
Quarter
Third
Quarter
Fourth
Quarter
2004
Operating revenues $ 4,512 $ 4,830 $ 4,762 $ 4,541
Operating income (loss) 42 196 (27) (355)
Net earnings (loss) (166) 6 (214) (387)
Earnings (loss) per share:
Basic (1.03) 0.04 (1.33) (2.40)
Diluted (1.03) 0.03 (1.33) (2.40)
2003
Operating revenues $ 4,120 $ 4,324 $ 4,605 $ 4,391
Operating income (loss) (869) 87 165 (227)
Net earnings (loss) (1,043) (75) 1 (111)
Earnings (loss) per share:
Basic and diluted (6.68) (0.47) - (0.70)