Bank of America 2000 Annual Report Download - page 9
Download and view the complete annual report
Please find page 9 of the 2000 Bank of America annual report below. You can navigate through the pages in the report by either clicking on the pages listed below, or by using the keyword search tool below to find specific information within the annual report.-
 1
1 -
 2
2 -
 3
3 -
 4
4 -
 5
5 -
 6
6 -
 7
7 -
 8
8 -
 9
9 -
 10
10 -
 11
11 -
 12
12 -
 13
13 -
 14
14 -
 15
15 -
 16
16 -
 17
17 -
 18
18 -
 19
19 -
 20
20 -
21
-
22
-
23
-
24
-
25
-
26
-
27
-
28
-
29
-
30
-
31
-
32
-
33
-
34
-
35
-
36
 |
 |

7
Summary of Financial Performance
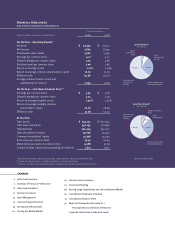
Operating earnings per share (diluted) for Bank of America rose 1% in 2000 to $4.72. Lower earnings in the fourth
quarter, driven by higher credit costs and sluggish revenue growth occurring in a slowing economy, significantly
moderated what had been a 12% increase in per-share earnings for the first nine months.
Operating earnings totaled $7.9 billion, compared to $8.2 billion in 1999. Average shares outstanding declined
by 5%, as the company repurchased 67.6 million of its shares, representing an investment of $3.3 billion during the year.
The return on equity was 16.70% while the return on average assets was 1.17%.
Total revenues for the year rose 2%, while noninterest expense was virtually unchanged. The provision for
credit losses rose substantially, to $2.5 billion, compared to $1.8 billion in 1999.
Net Income Including after-tax charges associated with growth initiatives and mergers, net income was $7.5 bil-
lion, or $4.52 per share (diluted), compared to $7.9 billion, or $4.48 per share, a year ago.
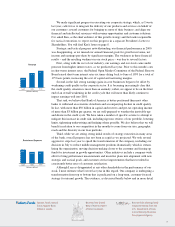
Revenue Revenues continued to grow due to broad-based increases in new business from the company’s diverse
customer base. The year-to-year comparison was negatively impacted by the absence of a number of one-time gains
recorded in 1999 and by higher auto lease residual charges in 2000.
Managed loans and leases rose 9% for the year, while deposit growth was 3%. Net interest income growth was
2%, as loan growth and higher trading-related revenues more than offset margin compression, caused in part by a
change in mix, and the significant cost of share repurchases.
Noninterest income rose 3%, as the result of double-digit increases in card fee revenue, investment and broker-
age service fees, equity investment gains and trading revenue. Noninterest income was negatively impacted by the
absence of sales and securitizations, which boosted the year-ago results, and the impact of a $278 million increase
in auto lease residual charges.
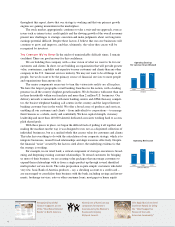
Expenses Noninterest expense was virtually unchanged, reflecting the second year of merger-related savings as well
as benefits from other productivity initiatives. The efficiency ratio was 54%, an improvement from 55% in 1999.
Credit Quality The provision for credit losses totaled $2.5 billion, up from $1.8 billion the previous year. While
the economy remained strong for the first half of 2000, rising interest rates took their toll in the second half, lead-
ing to higher problem loans and higher loan losses. Net charge-offs totaled $2.4 billion, or .61% of loans and leases,
compared to $2.0 billion, or .55%, a year earlier, with the increase occurring primarily in the domestic corporate
portfolio. Nonperforming assets stood at $5.5 billion at the end of 2000, up from $3.2 billion a year earlier. The
increase was largely due to increasing problem loans in the domestic corporate and consumer finance portfolios.
Capital Bank of America’s capital position remained strong in 2000. Total shareholders’ equity rose to $47.6 bil-
lion at December 31, 2000, representing 7.42% of period-end assets, up from 7.02%. The Tier 1 capital ratio also
rose to 7.50% from 7.35% at the end of 1999.
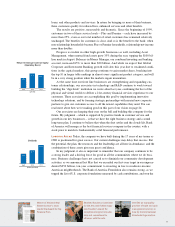
Business Segments Two of the company’s four primary business segments – Asset Management and Equity
Investments – increased earnings in 2000.
Consumer and Commercial Banking earnings of $4.64 billion were 2% lower than a year earlier, reflecting the
impact of a significant increase in auto lease residual charges and the absence of one-time gains recorded in the
previous year. The card businesses all achieved double-digit growth and service charge revenue was up 4% in the
Banking Regions. Average managed loans grew 12%. Expenses fell by 4%.
Asset Management earnings rose 18% to $601 million, as assets under management increased by $30 billion to
$277 billion at year-end, despite falling market prices. Mutual fund fees grew 30%. The company made significant
investments in new private banking offices and in sales personnel throughout the asset management businesses
during the year.
Global Corporate and Investment Banking earnings were 10% lower than a year earlier, reflecting higher loan
losses and slower capital markets activity at the end of the year. Higher credit costs more than offset revenue growth
of 9%, driven by the buildout of the investment banking and trading platforms. For the year, Bank of America
ranked in the top 10 in all key product areas.
Equity Investments earnings increased 39% to $460 million, driven by strong gains in strategic investments and
alliances as well as in principal investing.