Cabela's 2013 Annual Report Download - page 7
Download and view the complete annual report
Please find page 7 of the 2013 Cabela's annual report below. You can navigate through the pages in the report by either clicking on the pages listed below, or by using the keyword search tool below to find specific information within the annual report.-
 1
1 -
 2
2 -
 3
3 -
 4
4 -
 5
5 -
 6
6 -
 7
7 -
 8
8 -
 9
9 -
 10
10 -
 11
11 -
 12
12 -
 13
13 -
 14
14 -
 15
15 -
 16
16 -
 17
17 -
 18
18 -
19
-
20
-
21
-
22
-
23
-
24
-
25
-
26
-
27
-
28
-
29
-
30
-
31
-
32
-
33
-
34
-
35
-
36
-
37
-
38
-
39
-
40
-
41
-
42
-
43
-
44
-
45
-
46
-
47
-
48
-
49
-
50
-
51
-
52
-
53
-
54
-
55
-
56
-
57
-
58
-
59
-
60
-
61
-
62
-
63
-
64
-
65
-
66
-
67
-
68
-
69
-
70
-
71
-
72
-
73
-
74
-
75
-
76
-
77
-
78
-
79
-
80
-
81
-
82
-
83
-
84
-
85
-
86
-
87
-
88
-
89
-
90
-
91
-
92
-
93
-
94
-
95
-
96
-
97
-
98
-
99
-
100
-
101
-
102
-
103
-
104
-
105
-
106
-
107
-
108
-
109
-
110
-
111
-
112
-
113
-
114
-
115
-
116
-
117
-
118
-
119
-
120
-
121
-
122
-
123
-
124
-
125
-
126
-
127
-
128
-
129
-
130
-
131
-
132
 |
 |

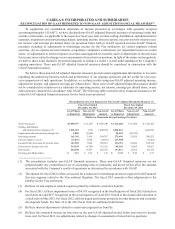
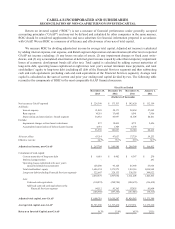
CABELA’S INCORPORATED AND SUBSIDIARIES
RECONCILIATION OF GAAP REPORTED TO NON-GAAP ADJUSTED FINANCIAL MEASURES(1)
To supplement our consolidated statements of income presented in accordance with generally accepted
accounting principles (“GAAP”), we have disclosed non-GAAP adjusted financial measures of operating results that
exclude certain items. As applicable to the respective fiscal year, total revenue; selling, distribution, and administrative
expenses; impairment and restructuring charges; operating income; interest expense, net; provision for income taxes;
net income; and earnings per diluted share are presented below both as GAAP reported and non-GAAP financial
measures excluding (i) adjustments to interchange income for the Visa settlement, (ii) certain employee related
expenses, (iii) an expense accrual related to a regulatory compliance examination, (iv) impairment losses on certain
assets, (v) adjustments to interest expense on certain unrecognized tax benefits, and (vi) adjustments to the provision
for income taxes related to changes in our assessments of uncertain tax positions. In light of the nature and magnitude,
we believe these items should be presented separately to enhance a reader’s overall understanding of the Company’s
ongoing operations. These non-GAAP adjusted financial measures should be considered in conjunction with the
GAAP financial measures.
We believe these non-GAAP adjusted financial measures provide useful supplemental information to investors
regarding the underlying business trends and performance of our ongoing operations and are useful for year-over-
year comparisons of such operations. In addition, we evaluate results using non-GAAP adjusted operating income,
adjusted net income, and adjusted earnings per diluted share. These non-GAAP adjusted financial measures should
not be considered in isolation or as a substitute for operating income, net income, earnings per diluted share, or any
other measure calculated in accordance with GAAP. The following table reconciles these financial measures to the
related GAAP adjusted financial measures for the fiscal years presented.
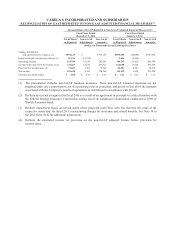
Reconciliation of GAAP Reported to Non-GAAP Adjusted Financial Measures (1)
Fiscal Year Ended
December 28, 2013 Fiscal Year Ended
December 29, 2012
GAAP Basis
as Reported Non-GAAP
Adjustments Non-GAAP
Amounts GAAP Basis
as Reported Non-GAAP
Adjustments Non-GAAP
Amounts
(Dollars in Thousands Except Earnings Per Share)
Total revenue (2) $3,599,577 $(3,167) $ 3,596,410 $3,112,682 $12,500 $3,125,182
Selling, distribution,
and administrative expenses (3) 1,201,519 (735)1,200,784 1,046,861 -1,046,861
Impairment and restructuring charges (4) 5,868 (5,868) - 20,324 (20,324) -
Operating income 361,361 3,436 364,797 275,699 32,824 308,523
Interest expense, net (5) (17,833)3,648 (14,185)(13,985) - (13,985)
Income before provision for income taxes 343,528 7,084 350,612 261,714 32,824 294,538
Provision for income taxes (6) 119,138 (6,783)112,355 88,201 11,062 99,263
Net income 224,390 13,867 238,257 173,513 21,762 195,275
Earnings per diluted share $3.13 $0.19 $3.32 $2.42 $0.30 $2.72
(1) The presentation includes non-GAAP financial measures. These non-GAAP financial measures are not
prepared under any comprehensive set of accounting rules or principles, and do not reflect all of the amounts
associated with the Company’s results of operations as determined in accordance with GAAP.
(2) The amount for fiscal 2012 reflects an accrual for a reduction in interchange income recognized in the Financial
Services segment related to the Visa antitrust litigation. The fiscal 2013 amounts reflect adjustments to the
liability for the Visa settlement.
(3) Reflects certain employee related expenses primarily related to severance benefits.
(4) For fiscal 2013, reflects impairment losses of $4,931 recognized in the fourth quarter of fiscal 2013 related to a
retail store site and $937 recognized in the second quarter of fiscal 2013 related to the closure and relocation of
a retail store in May 2013. For fiscal 2012, reflects impairment losses primarily on other property and economic
development bonds. See Note 14 in the 2013 Form 10-K for additional information.
(5) Reflects interest adjustments related to certain unrecognized tax benefits.
(6) Reflects the estimated income tax provision on the non-GAAP adjusted income before provision for income
taxes and, for fiscal 2013, tax adjustments related to changes in assessments of uncertain tax positions.