Cabela's 2013 Annual Report Download - page 8
Download and view the complete annual report
Please find page 8 of the 2013 Cabela's annual report below. You can navigate through the pages in the report by either clicking on the pages listed below, or by using the keyword search tool below to find specific information within the annual report.-
 1
1 -
 2
2 -
 3
3 -
 4
4 -
 5
5 -
 6
6 -
 7
7 -
 8
8 -
 9
9 -
 10
10 -
 11
11 -
 12
12 -
 13
13 -
 14
14 -
 15
15 -
 16
16 -
 17
17 -
 18
18 -
 19
19 -
20
-
21
-
22
-
23
-
24
-
25
-
26
-
27
-
28
-
29
-
30
-
31
-
32
-
33
-
34
-
35
-
36
-
37
-
38
-
39
-
40
-
41
-
42
-
43
-
44
-
45
-
46
-
47
-
48
-
49
-
50
-
51
-
52
-
53
-
54
-
55
-
56
-
57
-
58
-
59
-
60
-
61
-
62
-
63
-
64
-
65
-
66
-
67
-
68
-
69
-
70
-
71
-
72
-
73
-
74
-
75
-
76
-
77
-
78
-
79
-
80
-
81
-
82
-
83
-
84
-
85
-
86
-
87
-
88
-
89
-
90
-
91
-
92
-
93
-
94
-
95
-
96
-
97
-
98
-
99
-
100
-
101
-
102
-
103
-
104
-
105
-
106
-
107
-
108
-
109
-
110
-
111
-
112
-
113
-
114
-
115
-
116
-
117
-
118
-
119
-
120
-
121
-
122
-
123
-
124
-
125
-
126
-
127
-
128
-
129
-
130
-
131
-
132
 |
 |

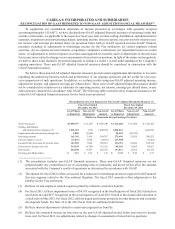
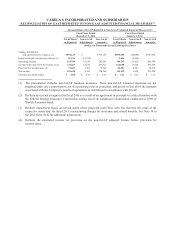
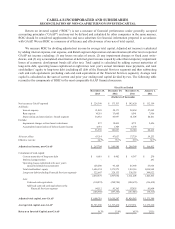
CABELA’S INCORPORATED AND SUBSIDIARIES
RECONCILIATION OF GAAP REPORTED TO NON-GAAP ADJUSTED FINANCIAL MEASURES(1)
Reconciliation of GAAP Reported to Non-GAAP Adjusted Financial Measures (1)
Fiscal Year Ended
December 31, 2011 Fiscal Year Ended
January 1, 2011
GAAP Basis
as Reported Non-GAAP
Adjustments Non-GAAP
Amounts GAAP Basis
as Reported Non-GAAP
Adjustments Non-GAAP
Amounts
(Dollars in Thousands Except Earnings Per Share)
Selling, distribution,
and administrative expenses (2) $954,125 $ - $ 954,125 $895,405 $(8,000) $ 887,405
Impairment and restructuring charges (3) 12,244 (12,244) - 5,626 (5,626) -
Operating income 231,548 12,244 243,792 186,762 13,626 200,388
Income before provision for income taxes 214,467 12,244 226,711 166,680 13,626 180,306
Provision for income taxes (4) 71,847 4,102 75,949 54,521 4,457 58,978
Net income 142,620 8,142 150,762 112,159 9,169 121,328
Earnings per diluted share $2.00 $0.12 $2.12 $1.62 $0.14 $1.76
(1) The presentation includes non-GAAP financial measures. These non-GAAP financial measures are not
prepared under any comprehensive set of accounting rules or principles, and do not reflect all of the amounts
associated with the Company’s results of operations as determined in accordance with GAAP.
(2) Reflects an accrual recognized in fiscal 2010 as a result of an agreement in principle to settle all matters with
the Federal Deposit Insurance Corporation arising out of its compliance examination conducted in 2009 of
World’s Foremost Bank.
(3) Reflects impairment losses on certain assets where projected cash flows were less than the fair value of the
respective assets and, for fiscal 2011, restructuring charges for severance and related benefits. See Note 14 in
the 2013 Form 10-K for additional information.
(4) Reflects the estimated income tax provision on the non-GAAP adjusted income before provision for
income taxes.