Charter 2000 Annual Report Download - page 22
Download and view the complete annual report
Please find page 22 of the 2000 Charter annual report below. You can navigate through the pages in the report by either clicking on the pages listed below, or by using the keyword search tool below to find specific information within the annual report.-
 1
1 -
2
-
3
-
4
-
5
-
6
-
7
-
8
-
9
-
10
-
11
-
 12
12 -
 13
13 -
 14
14 -
 15
15 -
 16
16 -
 17
17 -
 18
18 -
 19
19 -
 20
20 -
 21
21 -
 22
22 -
 23
23 -
 24
24 -
 25
25 -
 26
26 -
 27
27 -
 28
28 -
 29
29 -
 30
30 -
 31
31 -
 32
32
 |
 |

CHARTER COMMUNICATIONS 20CHARTER COMMUNICATIONS 20
FINANCIAL HIGHLIGHTS
RECENT ACQUISITIONS
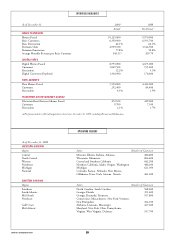
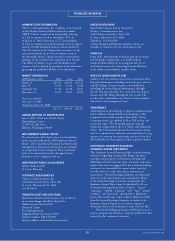
Acquisition summary
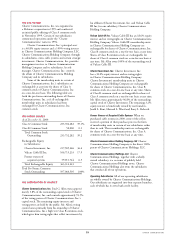
Since January 1, 1999, we have completed sixteen acquisi-
tions for a total purchase price of $14.3 billion consisting
of cash payments of $9.1 billion, $3.3 billion of assumed
debt and $1.9 billion of equity interests issued. These
acquisitions were funded through the issuance of stock and
long-term debt, bank borrowings and internally generated
funds. All acquisitions were accounted for under the pur-
chase method of accounting and results of operations were
included in our consolidated financial statements from the
respective dates of acquisition.
Acquisition Acquired
Company Date Customers
Renaissance 4/99 134,000
American Cable 5/99 69,000
Greater Media Systems 6/99 176,000
Helicon 7/99 171,000
Vista 7/99 26,000
Cable Satellite 8/99 9,000
Rifkin 9/99 463,000
InterMedia 10/99 278,000
Fanch 11/99 535,600
Falcon 11/99 977,200
Avalon 11/99 270,800
Interlake 1/00 6,000
Bresnan 2/00 695,800
Capital Cable 4/00 23,200
Farmington Cablevision 4/00 5,700
Cablevision of Michigan 9/00 50,700
Total Acquisitions 3,891,000
Pending AT&T transactions
In February 2001, we entered into several agreements with
AT&T Broadband, LLC involving several strategic cable
system transactions that will result in a net addition of
approximately 512,000 customers for the Charter cable
systems. We expect to acquire cable systems from AT&T
Broadband serving approximately 574,000 customers in
Missouri, Alabama, Nevada and California for a total of
$1.79 billion. A portion of the purchase price will consist
of Charter cable systems valued at $249.0 million serving
approximately 62,000 customers in Florida, resulting in
a net addition of 512,000 customers. Of the balance of
the purchase price, up to $501.5 million will be paid in
Class A common stock and the remainder will be paid
in cash. Charter Communications Holdings, LLC and its
subsidiary Charter Communications Holdings Capital
Corporation have a commitment for a loan from Morgan
Stanley Senior Funding, Inc. and Goldman Sachs Credit
Partners LP for temporary financing of the cash portion
of the purchase price. We expect to obtain permanent
financing through one or more debt or equity financing
transactions or a combination thereof. The acquisition
transactions are expected to close in the second and/or
third quarters of 2001, subject to certain closing condi-
tions and regulatory review.
OVERVIEW OF OPERATIONS
Approximately 87% of our revenues for the year ended
December 31, 2000 are attributable to monthly subscrip-
tion fees charged to customers for our basic, expanded
basic, premium and digital cable television programming
services, Internet access through television-based service,
dial-up telephone modems and high-speed cable modem
service, equipment rental and ancillary services provided
by our cable systems. The remaining 13% of revenues is
derived from installation and reconnection fees charged to
customers to commence or reinstate service, pay-per-view
programming, where users are charged a fee for individual
programs requested, advertising revenues and commissions
related to the sale of merchandise by home shopping serv-
ices and franchise revenues. We have generated increased
revenues in each of the past three years, primarily through
customer growth from acquisitions, internal customer
growth, basic and expanded tier rate increases and revenues
from new services and products.
Our expenses primarily consist of operating costs,
general and administrative expenses, depreciation and
amortization expense, interest expense and management
fees/corporate expense charges. Operating costs primarily
include programming costs, cable service related expenses,
marketing and advertising costs, franchise fees and
expenses related to customer billings.
We have had a history of net losses and expect to
continue to report net losses for the foreseeable future.
The principal reasons for our prior and anticipated net
losses include depreciation and amortization expenses
associated with our acquisitions and capital expenditures
related to the construction and upgrading of our systems,
and interest costs on borrowed money. We cannot predict
what impact, if any, continued losses will have on our
ability to finance our operations in the future.
FISCAL 2000 COMPARED TO FISCAL 1999
Revenues Revenues increased by $1,821.0 million or
127% from $1,428.2 million in 1999 to $3,249.2 million
in 2000. System operations acquired after January 1, 1999
accounted for $1,578.3 million or 87% of the increase
in 2000, while systems acquired before January 1, 1999
accounted for $242.7 million or 13%.
In 2000, we added 898,300 basic customers, growing
from 5,452,600 to 6,350,900, of which approximately
741,100 were the result of acquisitions. The remaining
157,200 relate to internal growth, which is an increase
of approximately 2.5% compared to the prior year on
a pro forma basis.
Premium units increased by 2,094,700 from
2,844,400 to 4,939,100, of which approximately
300,100 were a result of acquisitions. The remaining
increase of 1,794,600 is the result of aggressive marketing
and pricing of premium products related to upgrades.
In 2000, we added 943,300 digital customers,
growing from 126,200 to 1,069,500. Of the total increase,
approximately 29,200 were the result of acquisitions and
914,100 were the result of internal growth or upgrades.
The pace of growth increased throughout the year as we
upgraded our systems. We surpassed our expectations
throughout the year, with an average of 17,500 digital
installations per week during 2000 which increased to
40,000 digital installations per week in December 2000.
Growth was a result of intense marketing efforts and
strong demand for digital service.