DTE Energy 2010 Annual Report Download - page 34
Download and view the complete annual report
Please find page 34 of the 2010 DTE Energy annual report below. You can navigate through the pages in the report by either clicking on the pages listed below, or by using the keyword search tool below to find specific information within the annual report.-
 1
1 -
2
-
3
-
4
-
5
-
6
-
7
-
8
-
9
-
10
-
11
-
12
-
13
-
14
-
15
-
16
-
17
-
18
-
19
-
20
-
21
-
22
-
23
-
 24
24 -
 25
25 -
 26
26 -
 27
27 -
 28
28 -
 29
29 -
 30
30 -
 31
31 -
 32
32 -
 33
33 -
 34
34 -
 35
35 -
 36
36 -
 37
37 -
 38
38 -
 39
39
 |
 |

32
The Company also participates in defined contribution retirement savings plans for DTE Energy and its affiliates. Participation in one
of these plans is available to substantially all represented and non-represented employees. The Company matches employee
contributions up to certain predefined limits based upon eligible compensation, the employee’s contribution rate and, in some cases,
years of credited service. The cost of these plans was $4 million in each of the years 2010, 2009, and 2008.
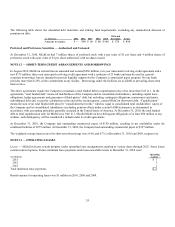
Other Postretirement Benefits
The Company participates in plans sponsored by LLC that provide certain postretirement health care and life insurance benefits for
employees who are eligible for these benefits. The Company’ s policy is to fund certain trusts to meet our postretirement benefit
obligations. Separate qualified Voluntary Employees Beneficiary Association (VEBA) trusts exist for represented and non-represented
employees. In 2010, the Company contributed $70 million to the VEBA trusts, including a transfer of $25 million from the MichCon
Grantor Trust. The Company contributed $45 million to the VEBA trusts in January 2011. At the discretion of management, subject
to MPSC requirements, the Company does not plan on making additional contributions to the VEBA trusts in 2011. Net
postretirement cost includes the following components:
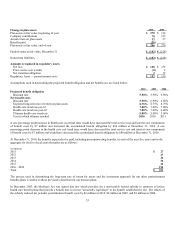
(in Millions)
2010
2009
Other changes in plan assets and APBO recognized in regulatory assets
Net actuarial (gain) loss
$ 31
$ (16)
Amortization of net actuarial gain
(9)
(7)
Prior service credit
(16)
—
Amortization of prior service credit
(1)
(1)
Amortization of transition obligation
(3)
(3)
Total recognized in regulatory assets
$ 2
$ (27)
Total recognized in net postretirement cost and regulatory assets
$ 34
$ 9
Estimated amounts to be amortized from regulatory assets into net periodic benefit cost during next fiscal
year
Net actuarial loss
$ 13
$ 8
Prior service cost (credit)
(2)
1
Net transition obligation
1
3
$ 12
$ 12
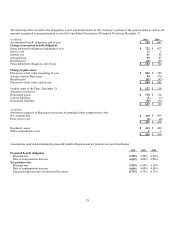
The following table reconciles the obligations, assets and funded status of the Company’s portion of the plans including amounts
recorded as accrued postretirement cost in the Consolidated Statements of Financial Position at December 31:
(in Millions)
2010
2009
2008
Service cost
$ 14
$ 13
$ 14
Interest cost
28
30
27
Expected return on plan assets
(23)
(18)
(17)
Amortization of
Net loss
9
7
5
Prior service cost
1
1
1
Net transition obligation
3
3
3
Net postretirement cost
$ 32
$ 36
$ 33
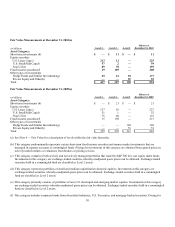
(in Millions)
2010
2009
Change in accumulated postretirement benefit obligation
Accumulated postretirement benefit obligation, beginning of year
$ 488
$ 466
Service cost
14
13
Interest cost
28
30
Plan amendments
(16)
—
Actuarial loss
39
3
Benefits paid and Medicare Part D
(25)
(24)
Accumulated postretirement benefit obligation, end of year
$ 528
$ 488