DTE Energy 2010 Annual Report Download - page 35
Download and view the complete annual report
Please find page 35 of the 2010 DTE Energy annual report below. You can navigate through the pages in the report by either clicking on the pages listed below, or by using the keyword search tool below to find specific information within the annual report.-
 1
1 -
2
-
3
-
4
-
5
-
6
-
7
-
8
-
9
-
10
-
11
-
12
-
13
-
14
-
15
-
16
-
17
-
18
-
19
-
20
-
21
-
22
-
23
-
24
-
 25
25 -
 26
26 -
 27
27 -
 28
28 -
 29
29 -
 30
30 -
 31
31 -
 32
32 -
 33
33 -
 34
34 -
 35
35 -
 36
36 -
 37
37 -
 38
38 -
 39
39
 |
 |

33
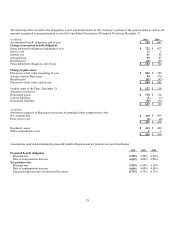
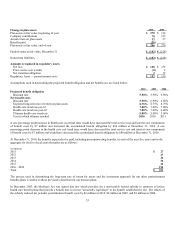
Assumptions used in determining the projected benefit obligation and net benefit cost are listed below:
2010
2009
2008
Projected benefit obligation
Discount rate
5.50%
5.90%
6.90%
Net benefit costs
Discount rate
5.90%
6.90%
6.50%
Expected long-term rate of return on plan assets
8.75%
8.75%
8.75%
Health care trend rate pre-65
7.00%
7.00%
7.00%
Health care trend rate post-65
7.00%
7.00%
6.00%
Ultimate health care trend rate
5.00%
5.00%
5.00%
Year in which ultimate reached
2016
2016
2011
A one percentage point increase in health care cost trend rates would have increased the total service cost and interest cost components
of benefit costs by $7 million and increased the accumulated benefit obligation by $54 million at December 31, 2010. A one
percentage point decrease in the health care cost trend rates would have decreased the total service cost and interest cost components
of benefit costs by $7 million and would have decreased the accumulated benefit obligation by $80 million at December 31, 2010.
At December 31, 2010, the benefits expected to be paid, including prescription drug benefits, in each of the next five years and in the
aggregate for the five fiscal years thereafter are as follows:
(in Millions)
2011
$ 27
2012
27
2013
32
2014
34
2015
35
2016 - 2020
196
Total
$ 351
The process used in determining the long-term rate of return for assets and the investment approach for our other postretirement
benefits plans is similar to those previously described for our pension plans.
In December 2003, the Medicare Act was signed into law which provides for a non-taxable federal subsidy to sponsors of retiree
health care benefit plans that provide a benefit that is at least “actuarially equivalent” to the benefit established by law. The effects of
the subsidy reduced net periodic postretirement benefit costs by $2 million in 2010, $4 million in 2009, and $3 million in 2008.
Change in plan assets
2010
2009
Plan assets at fair value, beginning of year
$ 270
$ 118
Company contributions
70
115
Actual return on plan assets
32
37
Benefits paid
(26)
—
Plan assets at fair value, end of year
$ 346
$ 270
Funded status at fair value, December 31
$ (182)
$ (218)
Noncurrent liabilities
$ (182)
$ (218)
Amounts recognized in regulatory assets
Net loss
$ 158
$ 136
Prior service cost (credit)
(8)
2
Net transition obligation
2
12
Regulatory Asset — postretirement costs
$ 152
$ 150