DTE Energy 2010 Annual Report Download - page 36
Download and view the complete annual report
Please find page 36 of the 2010 DTE Energy annual report below. You can navigate through the pages in the report by either clicking on the pages listed below, or by using the keyword search tool below to find specific information within the annual report.-
 1
1 -
2
-
3
-
4
-
5
-
6
-
7
-
8
-
9
-
10
-
11
-
12
-
13
-
14
-
15
-
16
-
17
-
18
-
19
-
20
-
21
-
22
-
23
-
24
-
25
-
 26
26 -
 27
27 -
 28
28 -
 29
29 -
 30
30 -
 31
31 -
 32
32 -
 33
33 -
 34
34 -
 35
35 -
 36
36 -
 37
37 -
 38
38 -
 39
39
 |
 |

34
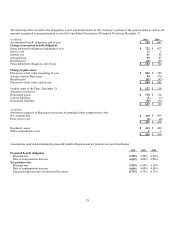
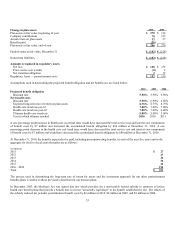
At December 31, 2010, the gross amount of federal subsidies expected to be received in each of the next two years is estimated to be
$2 million in 2011 and 2012, respectively.
Target allocations for plan assets as of December 31, 2010 are listed below:
U.S. Equity Securities
25%
Non U.S. Equity Securities
20
Fixed Income Securities
25
Hedge Funds and Similar Investments
20
Private Equity and Other
10
100%
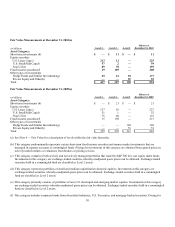
Fair Value Measurements at December 31, 2010(a)
(in Millions)
Level 1
Level 2
Level 3
Balance at
December 31, 2010
Asset Category:
Short-term investments(b)
$ —
$ 3
$ —
$ 3
Equity securities
U.S. Large Cap(c)
42
21
—
63
U.S. Small/Mid Cap(d)
20
19
—
39
Non U.S(e)
27
41
—
68
Fixed income securities(f)
1
85
—
86
Other types of investments
Hedge Funds and Similar Investments(g)
26
16
30
72
Private Equity and Other(h)
—
—
15
15
Total
$ 116
$ 185
$ 45
$ 346
Fair Value Measurements at December 31, 2009(a)
(in Millions)
Level 1
Level 2
Level 3
Balance at
December 31, 2009
Asset Category:
Short-term investments(b)
$ —
$ 5
$ —
$ 5
Equity securities
U.S. Large Cap(c)
46
25
—
71
U.S. Small/Mid Cap(d)
14
16
—
30
Non U.S(e)
23
22
—
45
Fixed income securities(f)
3
73
—
76
Other types of investments
Hedge Funds and Similar Investments(g)
—
—
29
29
Private Equity and Other(h)
—
—
14
14
Total
$ 86
$ 141
$ 43
$ 270
(a) See Note 4 — Fair Value for a description of levels within the fair value hierarchy.
(b) This category predominantly represents certain short-term fixed income securities and money market investments that are
managed in separate accounts or commingled funds. Pricing for investments in this category are obtained from quoted prices in
actively traded markets or valuations from brokers or pricing services.
(c) This category comprises both actively and not actively managed portfolios that track the S&P 500 low cost equity index funds.
Investments in this category are exchange-traded securities whereby unadjusted quote prices can be obtained. Exchange-traded
securities held in a commingled fund are classified as Level 2 assets.