DTE Energy 2010 Annual Report Download - page 4
Download and view the complete annual report
Please find page 4 of the 2010 DTE Energy annual report below. You can navigate through the pages in the report by either clicking on the pages listed below, or by using the keyword search tool below to find specific information within the annual report.-
 1
1 -
 2
2 -
 3
3 -
 4
4 -
 5
5 -
 6
6 -
 7
7 -
 8
8 -
 9
9 -
 10
10 -
 11
11 -
 12
12 -
 13
13 -
 14
14 -
 15
15 -
16
-
17
-
18
-
19
-
20
-
21
-
22
-
23
-
24
-
25
-
26
-
27
-
28
-
29
-
30
-
31
-
32
-
33
-
34
-
35
-
36
-
37
-
38
-
39
 |
 |

2
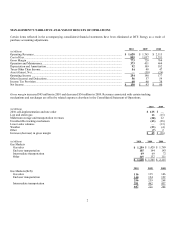
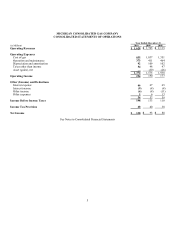
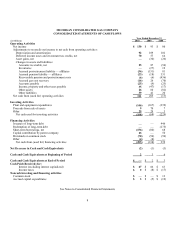
MANAGEMENT’S NARRATIVE ANALYSIS OF RESULTS OF OPERATIONS
Certain items reflected in the accompanying consolidated financial statements have been eliminated at DTE Energy as a result of
purchase accounting adjustments.
2010
2009
2008
(in Millions)
Operating Revenues ..........................................................................................................................
$ 1,628
$ 1,765
$ 2,115
Cost of Gas .......................................................................................................................................
855
1,037
1,351
Gross Margin ....................................................................................................................................
773
728
764
Operation and Maintenance ..............................................................................................................
373
411
464
Depreciation and Amortization .........................................................................................................
92
109
102
Taxes Other Than Income .................................................................................................................
54
48
47
Asset (Gains), Net .............................................................................................................................
—
(30)
(26)
Operating Income .............................................................................................................................
254
190
177
Other (Income) and Deductions ........................................................................................................
56
57
59
Income Tax Provision .......................................................................................................................
68
40
38
Net Income .......................................................................................................................................
$ 130
$ 93
$ 80
Gross margin increased $45 million in 2010 and decreased $36 million in 2009. Revenues associated with certain tracking
mechanisms and surcharges are offset by related expenses elsewhere in the Consolidated Statement of Operations.
2010
2009
(in Millions)
2010 self-implementation and rate order
$ 125
$ —
Lost and stolen gas
13
(15)
Midstream storage and transportation revenues
(20)
22
Uncollectible tracking mechanism
(43)
(28)
Lower sales volumes
—
(13)
Weather
(23)
(4)
Other
(7)
2
Increase (decrease) in gross margin
$ 45
$ (36)
(in Millions)
2010
2009
2008
Gas Markets
Gas sales
$ 1,259
$ 1,420
$ 1,789
End user transportation
185
144
143
Intermediate transportation
69
69
72
Other
115
132
111
$ 1,628
$ 1,765
$ 2,115
2010
2009
2008
Gas Markets (Bcf))
Gas sales
116
135
146
End user transportation
140
124
122
256
259
268
Intermediate transportation
391
462
437
647
721
705