HSBC 2007 Annual Report Download - page 229
Download and view the complete annual report
Please find page 229 of the 2007 HSBC annual report below. You can navigate through the pages in the report by either clicking on the pages listed below, or by using the keyword search tool below to find specific information within the annual report.-
 1
1 -
2
-
3
-
4
-
5
-
6
-
7
-
8
-
9
-
10
-
11
-
12
-
13
-
14
-
15
-
16
-
17
-
18
-
19
-
20
-
21
-
22
-
23
-
24
-
25
-
26
-
27
-
28
-
29
-
30
-
31
-
32
-
33
-
34
-
35
-
36
-
37
-
38
-
39
-
40
-
41
-
42
-
43
-
44
-
45
-
46
-
47
-
48
-
49
-
50
-
51
-
52
-
53
-
54
-
55
-
56
-
57
-
58
-
59
-
60
-
61
-
62
-
63
-
64
-
65
-
66
-
67
-
68
-
69
-
70
-
71
-
72
-
73
-
74
-
75
-
76
-
77
-
78
-
79
-
80
-
81
-
82
-
83
-
84
-
85
-
86
-
87
-
88
-
89
-
90
-
91
-
92
-
93
-
94
-
95
-
96
-
97
-
98
-
99
-
100
-
101
-
102
-
103
-
104
-
105
-
106
-
107
-
108
-
109
-
110
-
111
-
112
-
113
-
114
-
115
-
116
-
117
-
118
-
119
-
120
-
121
-
122
-
123
-
124
-
125
-
126
-
127
-
128
-
129
-
130
-
131
-
132
-
133
-
134
-
135
-
136
-
137
-
138
-
139
-
140
-
141
-
142
-
143
-
144
-
145
-
146
-
147
-
148
-
149
-
150
-
151
-
152
-
153
-
154
-
155
-
156
-
157
-
158
-
159
-
160
-
161
-
162
-
163
-
164
-
165
-
166
-
167
-
168
-
169
-
170
-
171
-
172
-
173
-
174
-
175
-
176
-
177
-
178
-
179
-
180
-
181
-
182
-
183
-
184
-
185
-
186
-
187
-
188
-
189
-
190
-
191
-
192
-
193
-
194
-
195
-
196
-
197
-
198
-
199
-
200
-
201
-
202
-
203
-
204
-
205
-
206
-
207
-
208
-
209
-
210
-
211
-
212
-
213
-
214
-
215
-
216
-
217
-
218
-
 219
219 -
 220
220 -
 221
221 -
 222
222 -
 223
223 -
 224
224 -
 225
225 -
 226
226 -
 227
227 -
 228
228 -
 229
229 -
 230
230 -
 231
231 -
 232
232 -
 233
233 -
 234
234 -
 235
235 -
 236
236 -
 237
237 -
 238
238 -
 239
239 -
240
-
241
-
242
-
243
-
244
-
245
-
246
-
247
-
248
-
249
-
250
-
251
-
252
-
253
-
254
-
255
-
256
-
257
-
258
-
259
-
260
-
261
-
262
-
263
-
264
-
265
-
266
-
267
-
268
-
269
-
270
-
271
-
272
-
273
-
274
-
275
-
276
-
277
-
278
-
279
-
280
-
281
-
282
-
283
-
284
-
285
-
286
-
287
-
288
-
289
-
290
-
291
-
292
-
293
-
294
-
295
-
296
-
297
-
298
-
299
-
300
-
301
-
302
-
303
-
304
-
305
-
306
-
307
-
308
-
309
-
310
-
311
-
312
-
313
-
314
-
315
-
316
-
317
-
318
-
319
-
320
-
321
-
322
-
323
-
324
-
325
-
326
-
327
-
328
-
329
-
330
-
331
-
332
-
333
-
334
-
335
-
336
-
337
-
338
-
339
-
340
-
341
-
342
-
343
-
344
-
345
-
346
-
347
-
348
-
349
-
350
-
351
-
352
-
353
-
354
-
355
-
356
-
357
-
358
-
359
-
360
-
361
-
362
-
363
-
364
-
365
-
366
-
367
-
368
-
369
-
370
-
371
-
372
-
373
-
374
-
375
-
376
-
377
-
378
-
379
-
380
-
381
-
382
-
383
-
384
-
385
-
386
-
387
-
388
-
389
-
390
-
391
-
392
-
393
-
394
-
395
-
396
-
397
-
398
-
399
-
400
-
401
-
402
-
403
-
404
-
405
-
406
-
407
-
408
-
409
-
410
-
411
-
412
-
413
-
414
-
415
-
416
-
417
-
418
-
419
-
420
-
421
-
422
-
423
-
424
-
425
-
426
-
427
-
428
-
429
-
430
-
431
-
432
-
433
-
434
-
435
-
436
-
437
-
438
-
439
-
440
-
441
-
442
-
443
-
444
-
445
-
446
-
447
-
448
-
449
-
450
-
451
-
452
-
453
-
454
-
455
-
456
-
457
-
458
-
459
-
460
-
461
-
462
-
463
-
464
-
465
-
466
-
467
-
468
-
469
-
470
-
471
-
472
-
473
-
474
-
475
-
476
 |
 |

227
partly offset by a decline in the UK, where changes
in underwriting practices resulted in a fall in
personal unsecured lending in 2007.
In Hong Kong, impaired loans declined by
4 per cent to US$433 million. Credit conditions were
very favourable, reflecting the strong local economy
and buoyant equity and property markets.
In Rest of Asia-Pacific, the decline in impaired
loans of 11 per cent to US$1.1 billion was mainly
driven by lower impaired loans in Taiwan following
the non-recurrence of the effect of regulatory
changes which, in 2006, led to a significant increase
in impaired loans. This was partly offset by a rise in
impaired loans in India due to strong growth in
personal lending.
In North America, HSBC recorded a
73 per cent increase in impaired loans to
US$8.4 billion at 31 December 2007. The consumer
finance business in the US was responsible for the
bulk of the change. HSBC Finance experienced a
deterioration in credit quality in most of its lending
book, in particular for first and second lien
mortgages originated in 2005 and 2006. In the final
quarter of the year, in line with the market,
delinquencies rose in the credit card portfolio, with a
smaller rise in vehicle finance loans. A full
discussion of these developments and their effect on
credit quality is provided in the ‘Areas of special
interest’ commentary on page 216. In Canada,
although impaired loans rose from a low base, credit
conditions remained strong.
In Latin America, impaired loans increased by
30 per cent to US$2.1 billion, primarily due to a rise
of 76 per cent in impaired loans in Mexico. This was
due to portfolio growth, seasoning and higher
delinquency rates on credit cards. Revenues from
this growth in credit card lending more than covered
the rise in impairment charges.
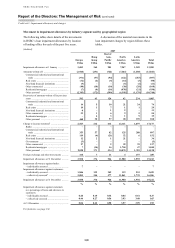
Individually impaired loans and advances to customers
(Audited)
Europe
Hong
Kong
Rest of
Asia-
Pacific
North
America
Latin
America
Gross
impaired
loans and
advances to
customers
% of total
gross
impaired
loans1
US$m US$m US$m US$m US$m US$m %
At 31 December 2007
Individually impaired loans and
advances to customers:
– personal ............................... 1,073 178 225 68 4 1,548 23.9
– commercial and corporate ... 3,485 200 453 353 438 4,929 76.1
4,558 378 678 421 442 6,477 100.0
At 31 December 2006
Individually impaired loans and
advances to customers:
– personal ............................... 975 231 118 173 1 1,498
25.7
– commercial and corporate ... 3,056 176 531 248 324 4,335 74.3
4,031 407 649 421 325 5,833
100.0
1 Gross impaired loans by industry sector as a percentage of total gross impaired loans.
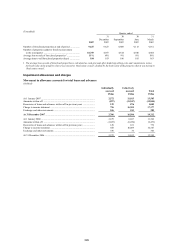
Interest forgone on impaired loans
(Audited)
Interest income that would have been recognised
under the original terms of impaired and restructured
loans amounted to approximately US$1.1 billion
in 2007 (2006: US$0.7 billion). Interest income from
such loans of approximately US$374 million was
recorded in 2007.
Renegotiated loans
(Audited)
Restructuring activity is designed to manage
customer relationships, maximise collection
opportunities and, if possible, avoid foreclosure or
repossession. Such activities include extended
payment arrangements, approved external debt
management plans, deferring foreclosure,
modification, loan rewrites and/or deferral of
payments pending a change in circumstances.
Following restructuring, an overdue consumer
account is normally reset from delinquent to current
status. Restructuring policies and practices are based
on indicators or criteria which, in the judgement of
local management, indicate that repayment will
probably continue. These policies are required to be
kept under continual review and their application
varies according to the nature of the market, the