HSBC 2007 Annual Report Download - page 234
Download and view the complete annual report
Please find page 234 of the 2007 HSBC annual report below. You can navigate through the pages in the report by either clicking on the pages listed below, or by using the keyword search tool below to find specific information within the annual report.-
 1
1 -
2
-
3
-
4
-
5
-
6
-
7
-
8
-
9
-
10
-
11
-
12
-
13
-
14
-
15
-
16
-
17
-
18
-
19
-
20
-
21
-
22
-
23
-
24
-
25
-
26
-
27
-
28
-
29
-
30
-
31
-
32
-
33
-
34
-
35
-
36
-
37
-
38
-
39
-
40
-
41
-
42
-
43
-
44
-
45
-
46
-
47
-
48
-
49
-
50
-
51
-
52
-
53
-
54
-
55
-
56
-
57
-
58
-
59
-
60
-
61
-
62
-
63
-
64
-
65
-
66
-
67
-
68
-
69
-
70
-
71
-
72
-
73
-
74
-
75
-
76
-
77
-
78
-
79
-
80
-
81
-
82
-
83
-
84
-
85
-
86
-
87
-
88
-
89
-
90
-
91
-
92
-
93
-
94
-
95
-
96
-
97
-
98
-
99
-
100
-
101
-
102
-
103
-
104
-
105
-
106
-
107
-
108
-
109
-
110
-
111
-
112
-
113
-
114
-
115
-
116
-
117
-
118
-
119
-
120
-
121
-
122
-
123
-
124
-
125
-
126
-
127
-
128
-
129
-
130
-
131
-
132
-
133
-
134
-
135
-
136
-
137
-
138
-
139
-
140
-
141
-
142
-
143
-
144
-
145
-
146
-
147
-
148
-
149
-
150
-
151
-
152
-
153
-
154
-
155
-
156
-
157
-
158
-
159
-
160
-
161
-
162
-
163
-
164
-
165
-
166
-
167
-
168
-
169
-
170
-
171
-
172
-
173
-
174
-
175
-
176
-
177
-
178
-
179
-
180
-
181
-
182
-
183
-
184
-
185
-
186
-
187
-
188
-
189
-
190
-
191
-
192
-
193
-
194
-
195
-
196
-
197
-
198
-
199
-
200
-
201
-
202
-
203
-
204
-
205
-
206
-
207
-
208
-
209
-
210
-
211
-
212
-
213
-
214
-
215
-
216
-
217
-
218
-
219
-
220
-
221
-
222
-
223
-
 224
224 -
 225
225 -
 226
226 -
 227
227 -
 228
228 -
 229
229 -
 230
230 -
 231
231 -
 232
232 -
 233
233 -
 234
234 -
 235
235 -
 236
236 -
 237
237 -
 238
238 -
 239
239 -
 240
240 -
 241
241 -
 242
242 -
 243
243 -
 244
244 -
245
-
246
-
247
-
248
-
249
-
250
-
251
-
252
-
253
-
254
-
255
-
256
-
257
-
258
-
259
-
260
-
261
-
262
-
263
-
264
-
265
-
266
-
267
-
268
-
269
-
270
-
271
-
272
-
273
-
274
-
275
-
276
-
277
-
278
-
279
-
280
-
281
-
282
-
283
-
284
-
285
-
286
-
287
-
288
-
289
-
290
-
291
-
292
-
293
-
294
-
295
-
296
-
297
-
298
-
299
-
300
-
301
-
302
-
303
-
304
-
305
-
306
-
307
-
308
-
309
-
310
-
311
-
312
-
313
-
314
-
315
-
316
-
317
-
318
-
319
-
320
-
321
-
322
-
323
-
324
-
325
-
326
-
327
-
328
-
329
-
330
-
331
-
332
-
333
-
334
-
335
-
336
-
337
-
338
-
339
-
340
-
341
-
342
-
343
-
344
-
345
-
346
-
347
-
348
-
349
-
350
-
351
-
352
-
353
-
354
-
355
-
356
-
357
-
358
-
359
-
360
-
361
-
362
-
363
-
364
-
365
-
366
-
367
-
368
-
369
-
370
-
371
-
372
-
373
-
374
-
375
-
376
-
377
-
378
-
379
-
380
-
381
-
382
-
383
-
384
-
385
-
386
-
387
-
388
-
389
-
390
-
391
-
392
-
393
-
394
-
395
-
396
-
397
-
398
-
399
-
400
-
401
-
402
-
403
-
404
-
405
-
406
-
407
-
408
-
409
-
410
-
411
-
412
-
413
-
414
-
415
-
416
-
417
-
418
-
419
-
420
-
421
-
422
-
423
-
424
-
425
-
426
-
427
-
428
-
429
-
430
-
431
-
432
-
433
-
434
-
435
-
436
-
437
-
438
-
439
-
440
-
441
-
442
-
443
-
444
-
445
-
446
-
447
-
448
-
449
-
450
-
451
-
452
-
453
-
454
-
455
-
456
-
457
-
458
-
459
-
460
-
461
-
462
-
463
-
464
-
465
-
466
-
467
-
468
-
469
-
470
-
471
-
472
-
473
-
474
-
475
-
476
 |
 |

HSBC HOLDINGS PLC
Report of the Directors: The Management of Risk (continued)
Credit risk > Impairment allowances and charges / Provisions
232
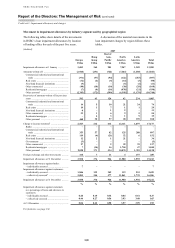
Movement in impairment allowances by industry segment and by geographical region (continued)
(Audited)
2005
Europe
Hong
Kong
Rest of
Asia-
Pacific
North
America
Latin
America
Total
US$m US$m US$m US$m US$m US$m
Impairment allowances at 1 January .................. 4,851 504 960 5,231 1,088 12,634
Amounts written off ........................................... (2,804) (294) (329) (4,913) (703) (9,043)
Commercial, industrial and international
trade ............................................................ (345) (157) (79) (81) (11) (673)
Real estate ....................................................... (67) (23) (11) (14) (2) (117)
Non-bank financial institutions ...................... (3) – – (10) – (13)
Other commercial ........................................... (108) – (6) (14) (66) (194)
Residential mortgages .................................... (14) (2) (6) (456) (30) (508)
Other personal ................................................ (2,267) (112) (227) (4,338) (594) (7,538)
Recoveries of amounts written off in previous
years ................................................................ 84 45 82 146 137 494
Commercial, industrial and international
trade ............................................................ 10 4 17 37 8 76
Real estate ....................................................... 5 – 1 2 1 9
Other commercial ........................................... 6 1 2 38 42 89
Residential mortgages .................................... 1 9 1 – 7 18
Other personal ................................................ 62 31 61 69 79 302
Net charge/(release) to income statement1 ......... 1,984 146 136 4,919 675 7,860
Banks .............................................................. (5) – (2) – – (7)
Commercial, industrial and international
trade ............................................................ 354 199 (72) 32 75 588
Real estate ....................................................... 59 – 1 (6) 2 56
Non-bank financial institutions ...................... (14) (1) – 9 – (6)
Governments .................................................. 4 – – 2 – 6
Other commercial ........................................... (21) (32) (1) (18) 46 (26)
Residential mortgages .................................... 5 (25) 7 592 26 605
Other personal ................................................ 1,602 5 203 4,308 526 6,644
Foreign exchange and other movements ............ (616) (3) (12) (34) 86 (579)
Impairment allowances at 31 December ............ 3,499 398 837 5,349 1,283 11,366
Impairment allowances against banks:
– individually assessed ................................... 8 – 1 – – 9
Impairment allowances against customers:
– individually assessed ................................... 1,575 173 500 221 214 2,683
– collectively assessed2 .................................. 1,916 225 336 5,128 1,069 8,674
Impairment allowances at 31 December ............ 3,499 398 837 5,349 1,283 11,366
% % % % % %
Impairment allowances against customers
as a percentage of loans and advances to
customers:
– individually assessed ................................... 0.50 0.21 0.71 0.09 0.93 0.36
– collectively assessed .................................... 0.61 0.27 0.47 1.99 4.65 1.16
At 31 December .................................................. 1.11 0.48 1.18 2.08 5.58 1.52
For footnotes, see page 234.