HSBC 2007 Annual Report Download - page 238
Download and view the complete annual report
Please find page 238 of the 2007 HSBC annual report below. You can navigate through the pages in the report by either clicking on the pages listed below, or by using the keyword search tool below to find specific information within the annual report.-
 1
1 -
2
-
3
-
4
-
5
-
6
-
7
-
8
-
9
-
10
-
11
-
12
-
13
-
14
-
15
-
16
-
17
-
18
-
19
-
20
-
21
-
22
-
23
-
24
-
25
-
26
-
27
-
28
-
29
-
30
-
31
-
32
-
33
-
34
-
35
-
36
-
37
-
38
-
39
-
40
-
41
-
42
-
43
-
44
-
45
-
46
-
47
-
48
-
49
-
50
-
51
-
52
-
53
-
54
-
55
-
56
-
57
-
58
-
59
-
60
-
61
-
62
-
63
-
64
-
65
-
66
-
67
-
68
-
69
-
70
-
71
-
72
-
73
-
74
-
75
-
76
-
77
-
78
-
79
-
80
-
81
-
82
-
83
-
84
-
85
-
86
-
87
-
88
-
89
-
90
-
91
-
92
-
93
-
94
-
95
-
96
-
97
-
98
-
99
-
100
-
101
-
102
-
103
-
104
-
105
-
106
-
107
-
108
-
109
-
110
-
111
-
112
-
113
-
114
-
115
-
116
-
117
-
118
-
119
-
120
-
121
-
122
-
123
-
124
-
125
-
126
-
127
-
128
-
129
-
130
-
131
-
132
-
133
-
134
-
135
-
136
-
137
-
138
-
139
-
140
-
141
-
142
-
143
-
144
-
145
-
146
-
147
-
148
-
149
-
150
-
151
-
152
-
153
-
154
-
155
-
156
-
157
-
158
-
159
-
160
-
161
-
162
-
163
-
164
-
165
-
166
-
167
-
168
-
169
-
170
-
171
-
172
-
173
-
174
-
175
-
176
-
177
-
178
-
179
-
180
-
181
-
182
-
183
-
184
-
185
-
186
-
187
-
188
-
189
-
190
-
191
-
192
-
193
-
194
-
195
-
196
-
197
-
198
-
199
-
200
-
201
-
202
-
203
-
204
-
205
-
206
-
207
-
208
-
209
-
210
-
211
-
212
-
213
-
214
-
215
-
216
-
217
-
218
-
219
-
220
-
221
-
222
-
223
-
224
-
225
-
226
-
227
-
 228
228 -
 229
229 -
 230
230 -
 231
231 -
 232
232 -
 233
233 -
 234
234 -
 235
235 -
 236
236 -
 237
237 -
 238
238 -
 239
239 -
 240
240 -
 241
241 -
 242
242 -
 243
243 -
 244
244 -
 245
245 -
 246
246 -
 247
247 -
 248
248 -
249
-
250
-
251
-
252
-
253
-
254
-
255
-
256
-
257
-
258
-
259
-
260
-
261
-
262
-
263
-
264
-
265
-
266
-
267
-
268
-
269
-
270
-
271
-
272
-
273
-
274
-
275
-
276
-
277
-
278
-
279
-
280
-
281
-
282
-
283
-
284
-
285
-
286
-
287
-
288
-
289
-
290
-
291
-
292
-
293
-
294
-
295
-
296
-
297
-
298
-
299
-
300
-
301
-
302
-
303
-
304
-
305
-
306
-
307
-
308
-
309
-
310
-
311
-
312
-
313
-
314
-
315
-
316
-
317
-
318
-
319
-
320
-
321
-
322
-
323
-
324
-
325
-
326
-
327
-
328
-
329
-
330
-
331
-
332
-
333
-
334
-
335
-
336
-
337
-
338
-
339
-
340
-
341
-
342
-
343
-
344
-
345
-
346
-
347
-
348
-
349
-
350
-
351
-
352
-
353
-
354
-
355
-
356
-
357
-
358
-
359
-
360
-
361
-
362
-
363
-
364
-
365
-
366
-
367
-
368
-
369
-
370
-
371
-
372
-
373
-
374
-
375
-
376
-
377
-
378
-
379
-
380
-
381
-
382
-
383
-
384
-
385
-
386
-
387
-
388
-
389
-
390
-
391
-
392
-
393
-
394
-
395
-
396
-
397
-
398
-
399
-
400
-
401
-
402
-
403
-
404
-
405
-
406
-
407
-
408
-
409
-
410
-
411
-
412
-
413
-
414
-
415
-
416
-
417
-
418
-
419
-
420
-
421
-
422
-
423
-
424
-
425
-
426
-
427
-
428
-
429
-
430
-
431
-
432
-
433
-
434
-
435
-
436
-
437
-
438
-
439
-
440
-
441
-
442
-
443
-
444
-
445
-
446
-
447
-
448
-
449
-
450
-
451
-
452
-
453
-
454
-
455
-
456
-
457
-
458
-
459
-
460
-
461
-
462
-
463
-
464
-
465
-
466
-
467
-
468
-
469
-
470
-
471
-
472
-
473
-
474
-
475
-
476
 |
 |

HSBC HOLDINGS PLC
Report of the Directors: The Management of Risk (continued)
Credit risk > Loan impairment charge > 2007
236
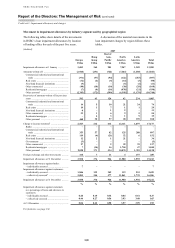
Net loan impairment charge to the income statement by geographical region (continued)
(Unaudited)
Year ended 31 December 2005
Europe
US$m
Hong
Kong
US$m
Rest of
Asia-
Pacific
US$m
North
America
US$m
Latin
America
US$m
Total
US$m
Individually assessed impairment allowances
New allowances .............................................. 1,029 200 131 299 56 1,715
Release of allowances no longer required ..... (648) (123) (166) (42) (19) (998)
Recoveries of amounts previously written
off ............................................................... (21) (18) (34) (101) (25) (199)
360 59 (69) 156 12 518
Collectively assessed impairment allowances
New allowances .............................................. 2,013 159 339 5,072 842 8,425
Release of allowances no longer required ..... (326) (45) (86) (264) (67) (788)
Recoveries of amounts previously written
off ............................................................... (63) (27) (48) (45) (112) (295)
1,624 87 205 4,763 663 7,342
Total charge for impairment losses .................... 1,984 146 136 4,919 675 7,860
Banks ............................................................. (5) – (2) – – (7)
Customers ...................................................... 1,989 146 138 4,919 675 7,867
% % % % % %
Charge for impairment losses as a percentage
of closing gross loans and advances .............. 0.55 0.12 0.15 1.83 2.11 0.90
US$m US$m US$m US$m US$m US$m
31 December 2005
Impaired loans .................................................... 5,081 506 945 3,710 1,226 11,468
Impairment allowances ....................................... 3,499 398 837 5,349 1,283 11,366
Net charge to the income statement for bad and doubtful debts by geographical region
(Unaudited)
Year ended 31 December 2004
Europe
US$m
Hong
Kong
US$m
Rest of
Asia-
Pacific
US$m
North
America
US$m
Latin
America
US$m
Total
US$m
Specific provisions
New provisions ............................................... 2,047 237 419 5,690 479 8,872
Release of provisions no longer required ...... (726) (187) (199) (105) (49) (1,266)
Recoveries of amounts previously written
off ............................................................... (136) (47) (70) (504) (156) (913)
1,185 3 150 5,081 274 6,693
General provisions .............................................. (162) (223) (48) (63) (2) (498)
Total bad and doubtful debt charge .................... 1,023 (220) 102 5,018 272 6,195
Banks ............................................................. (7) – (1) – (2) (10)
Customers ...................................................... 1,030 (220) 103 5,018 274 6,205
% % % % % %
Bad and doubtful debt charge as a percentage
of closing gross loans and advances .............. 0.36 (0.28) 0.17 1.88 1.20 0.91
US$m US$m US$m US$m US$m US$m
31 December 2004
Non-performing loans ........................................ 6,039 696 1,160 3,555 977 12,427
Provisions ........................................................... 4,798 522 940 5,212 1,070 12,542