Humana 2000 Annual Report Download - page 14
Download and view the complete annual report
Please find page 14 of the 2000 Humana annual report below. You can navigate through the pages in the report by either clicking on the pages listed below, or by using the keyword search tool below to find specific information within the annual report.-
 1
1 -
2
-
3
-
 4
4 -
 5
5 -
 6
6 -
 7
7 -
 8
8 -
 9
9 -
 10
10 -
 11
11 -
 12
12 -
 13
13 -
 14
14 -
 15
15 -
 16
16 -
 17
17
 |
 |

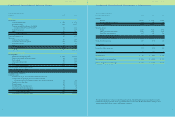
( I n mil l io n s)
F o r t he ye a rs e n de d De c em be r 3 1 , 2 0 0 0 1 9 9 9 1 9 9 8
Cash flows from operating activities
Net income (loss) $ 90 $ (382) $ 129
Adjustments to reconcile net income (loss)
to net cash provided by operating activities:
Asset write-downs and other charges 460 17
Depreciation and amortization 147 124 128
Gain on sale of property and equipment, net (3) (12)
Gain on sale of investment securities, net (6) (11) (21)
Provision for deferred income taxes 19 5 26
Provision for doubtful accounts 11 12 11
Payment for government audit settlement (15)
Changes in operating assets and liabilities:
Premiums receivable (1) 39 34
Other assets (9) 54 32
Medical and other expenses payable (195) (23) (22)
Workers’ compensation liabilities (30) (150) (134)
Other liabilities 39 42 (135)
Unearned premium revenues (16) 56 (10)
Other 9 3
Net cash provided by operating activities 40 217 55
Cash flows from investing activities
Acquisitions, net of cash and cash equivalents acquired (13) (14)
Divestitures, net of cash and cash equivalents disposed 29 (26)
Purchases of property and equipment (135) (89) (113)
Dispositions of property and equipment 21 54 12
Purchases of investment securities (1,205) (796) (1,053)
Maturities of investment securities 543 391 380
Proceeds from sales of investment securities 582 472 828
Net cash (used in) provided by investing activities (178) 18 28
Cash flows from financing activities
Revolving credit agreement borrowings 520 123
Revolving credit agreement repayments (93) (330)
Net commercial paper (repayments) borrowings (606) (44) 141
Change in book overdraft (66) (19) 82
Common stock repurchases (26)
Other (4) (14) 35
Net cash (used in) provided by financing activities (182) (170) 51
(Decrease) increase in cash and cash equivalents (320) 65 134
Cash and cash equivalents at beginning of period 978 913 779
Cash and cash equivalents at end of period $ 658 $ 978 $ 913
C o n d e n s e d C o n s o l i d a t e d S t a t e m e n t s o f C a s h F l o w s
HUMANA INC.
Capital Accumulated Unearned
In Excess Other Restricted Total
Common Stock of Par Retained Comprehensive Stock Treasury Stockholders’
(In millions) Issued Shares Amount Value Earnings (Loss) Income Compensation Stock Equity
Balances, January 1, 1998 164 $ 27 $ 844 $ 624 $ 9 $ (3) $ 1,501
Comprehensive income:
Net income 129 129
Other comprehensive income:
Net unrealized investment gains,
net of $2 tax 4 4
Comprehensive income 133
Restricted stock grant 8 (8) —
Restricted stock amortization 2 2
Stock option exercises 4 1 35 36
Stock option tax benefit 16 16
Balances, December 31, 1998 168 28 903 753 13 (9) 1,688
Comprehensive loss:
Net loss (382) (382)
Other comprehensive loss:
Net unrealized investment losses,
net of $27 tax (41) (41)
Comprehensive loss (423)
Restricted stock amortization 2 2
Restricted stock market value adjustment (5) 5 —
Stock option exercises 1 1
Balances, December 31, 1999 168 28 899 371 (28) (2) 1,268
Comprehensive income:
Net income 90 90
Other comprehensive income:
Net unrealized investment gains,
net of $13 tax 20 20
Comprehensive income 110
Common stock repurchases $ (26) (26)
Restricted stock grant 3 21 (33) 12 —
Restricted stock amortization 7 7
Restricted stock market value adjustment 2 (2) —
Stock option exercises 1 1
Balances, December 31, 2000 171 $ 28 $ 923 $ 461 $ (8) $ (30) $ (14) $ 1,360
C o n d e n s e d C o n s o l i d a t e d S t a t e m e n t s o f S t o c k h o l d e r s ’ E q u i t y
HUMANA INC.
24 25