LabCorp 2007 Annual Report Download - page 23
Download and view the complete annual report
Please find page 23 of the 2007 LabCorp annual report below. You can navigate through the pages in the report by either clicking on the pages listed below, or by using the keyword search tool below to find specific information within the annual report.-
 1
1 -
2
-
3
-
4
-
5
-
6
-
7
-
8
-
9
-
10
-
11
-
12
-
 13
13 -
 14
14 -
 15
15 -
 16
16 -
 17
17 -
 18
18 -
 19
19 -
 20
20 -
 21
21 -
 22
22 -
 23
23 -
 24
24 -
 25
25 -
 26
26 -
 27
27 -
 28
28 -
 29
29 -
 30
30 -
 31
31 -
 32
32 -
 33
33 -
34
-
35
-
36
-
37
-
38
-
39
-
40
-
41
-
42
-
43
-
44
-
45
-
46
-
47
-
48
-
49
-
50
-
51
-
52
-
53
-
54
-
55
-
56
-
57
-
58
-
59
-
60
 |
 |

Management’s Discussion and Analysis of Financial
Condition and Results of Operations (Dollars in millions)
Laboratory Corporation of America® Holdings 2007 21
RESULTS OF OPERATIONS
Years Ended December 31, 2007, 2006, and 2005
Net Sales
Years Ended December 31, % Change
2007 2006 2005 2007 2006
Net sales
Routine Testing $2,671.9 $2,347.6 $2,197.8 13.8% 6.8%
Genomic and Esoteric 1,396.3 1,243.2 1,129.8 12.3% 10.0%
Total $4,068.2 $3,590.8 $3,327.6 13.3% 7.9%
Number of Accessions
Years Ended December 31, % Change
2007 2006 2005 2007 2006
Volume
Routine Testing 85.4 76.7 74.8 11.3% 2.6%
Genomic and Esoteric 21.9 18.8 17.3 16.5% 8.6%
Total 107.3 95.5 92.1 12.3% 3.7%
Price Per Accession (“PPA”)
Years Ended December 31, % Change
2007 2006 2005 2007 2006
Price
Routine Testing $31.29 $30.60 $29.38 2.3% 4.1%
Genomic and Esoteric $63.76 $66.14 $65.26 (3.6)% 1.3%
Total $37.92 $37.59 $36.12 0.9% 4.1%
The increase in net sales for the three years ended December 31,
2007 has been driven primarily by volume growth in the Company’s
Managed Care business, the impact of acquisitions and the Company’s
continued shift in test mix to higher priced genomic and esoteric tests. As
a percentage of total net sales, Managed Care revenue has increased
during the three year period ended December 31, 2007 from 40.2%
in 2005 to 46.1% in 2007. The acquisitions of US Labs and Esoterix in
2005 have helped to build on the Company’s leadership position in the
genomic and esoteric market, which accounted for 34.3%, 34.6% and
34.0% of total net sales in 2007, 2006 and 2005, respectively.
Cost of Sales
Years Ended December 31, % Change
2007 2006 2005 2007 2006
Cost of sales $ 2,377.0 $ 2,061.4 $ 1,937.3 15.3% 6.4%
Cost of sales as
a % of sales 58.4% 57.4% 58.2%
Cost of sales, which includes primarily laboratory and distribution
costs, has increased over the three year period ended December 31,
2007 primarily due to increased volume in the Company’s Managed
Care business, the impact of acquisitions and the continued shift in
test mix to higher cost genomic and esoteric testing. As a percentage
of sales, cost of sales has increased during the three year period
ended December 31, 2007 from 58.2% in 2005 to 58.4% in 2007.
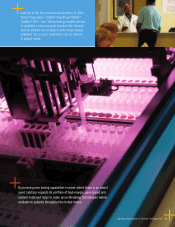
The increase in cost of sales was driven by the Company’s roll-out
of patient service centers and other customer service infrastructure,
along with increases in cost of materials due to shifts in the
Company’s test mix, coupled with providing new clients with speci-
men collection supplies. Labor and testing supplies comprise over
75% of the Company’s cost of sales.
Selling, General and Administrative Expenses
Years Ended December 31, % Change
2007 2006 2005 2007 2006
Selling, general and
administrative expenses $808.7 $779.1 $703.9 3.8% 10.7%
SG&A as a % of sales 19.9% 21.7% 21.2%
Total selling, general and administrative expenses (“SG&A”) as a
percentage of sales have decreased over the three year period ended
December 31, 2007. The Company has reduced its bad debt expense
rate over the three year period from 5.4% in 2005 to 4.8% in 2007. The
decrease in the bad debt expense rate is the result of improved billing
and collection performance. Other SG&A expenses increased in 2006
due to the Company’s adoption of SFAS 123(R) during the fi rst quarter
of 2006, which required the Company to record compensation expense
of $23.3 related to its stock option and stock purchase plans. During
the second half of fi scal year 2006, the Company recorded charges of
approximately $12.4, primarily related to the acceleration of the recog-
nition of stock compensation due to the retirement of the Company’s
Chief Executive Offi cer, which was effective December 31, 2006.
Amortization of Intangibles and Other Assets
Years Ended December 31, % Change
2007 2006 2005 2007 2006
Amortization of intangibles
and other assets $54.9 $52.2 $51.4 5.2% 1.6%
Laboratory Corporation of America