LabCorp 2007 Annual Report Download - page 40
Download and view the complete annual report
Please find page 40 of the 2007 LabCorp annual report below. You can navigate through the pages in the report by either clicking on the pages listed below, or by using the keyword search tool below to find specific information within the annual report.-
 1
1 -
2
-
3
-
4
-
5
-
6
-
7
-
8
-
9
-
10
-
11
-
12
-
13
-
14
-
15
-
16
-
17
-
18
-
19
-
20
-
21
-
22
-
23
-
24
-
25
-
26
-
27
-
28
-
29
-
 30
30 -
 31
31 -
 32
32 -
 33
33 -
 34
34 -
 35
35 -
 36
36 -
 37
37 -
 38
38 -
 39
39 -
 40
40 -
 41
41 -
 42
42 -
 43
43 -
 44
44 -
 45
45 -
 46
46 -
 47
47 -
 48
48 -
 49
49 -
 50
50 -
51
-
52
-
53
-
54
-
55
-
56
-
57
-
58
-
59
-
60
 |
 |

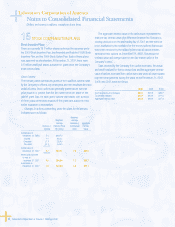
Notes to Consolidated Financial Statements
(Dollars and shares in millions, except per share data)
38 Laboratory Corporation of America® Holdings 2007
December 31, 2006 was $0.11 per share. In addition, in connection
with the adoption of SFAS 123R, net cash provided by operating activities
decreased and net cash provided by fi nancing activities increased
for the year ended December 31, 2006 by $9.1 related to excess tax
benefi ts from stock-based compensation arrangements.
During the second half of 2006, the Company recorded charges
of approximately $11.6, related to the acceleration of the recognition
of stock compensation due to the retirement of the Company’s Chief
Executive Offi cer, effective December 31, 2006.
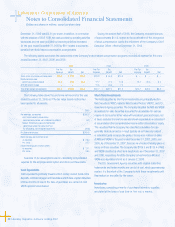
The following tables summarize the components of the Company’s stock-based compensation programs recorded as expense for the years
ended December 31, 2007, 2006, and 2005:
2007 2006 2005
Pre-Tax Tax Pre-Tax Tax Pre-Tax Tax
Expense Benefi t Net Expense Benefi t Net Expense Benefi t Net
Stock option and stock purchase plans $18.0 $ (7.2) $10.8 $23.3 $ (9.4) $13.9 $ – $ – $ –
Restricted stock and
performance share awards 17.4 (7.0) 10.4 17.7 (7.1) 10.6 13.7 (5.5) 8.2
CEO retirement charge – – – 11.6 (4.6) 7.0 – – –
Total share based compensation $35.4 $(14.2) $21.2 $52.7 $(21.1) $31.6 $13.7 $(5.5) $8.2
The following table shows the pro forma net income for the year
ended December 31, 2005 as if the fair value based method had
been applied to all awards:
2005
Net earnings, as reported $ 386.2
Add: Stock-based compensation
recorded as expense, net of related tax effects 8.2
Deduct: Total stock-based compensation
determined under fair value method
for all awards, net of related tax effects (24.8)
Pro forma net income $ 369.6
Basic earnings per common share
As reported $ 2.89
Pro forma 2.77
Diluted earnings per common share
As reported $ 2.71
Pro forma 2.55
See note 15 for assumptions used in calculating compensation
expense for the employee stock option and stock purchase plans.
Cash Equivalents
Cash equivalents (primarily investments in money market funds, time
deposits, commercial paper and Eurodollars which have original maturities
of three months or less at the date of purchase) are carried at cost
which approximates market.
Short-Term Investments
The items classifi ed as short-term investments are principally Auction
Rate Securities (“ARS”), Variable Rate Demand Notes (“VRDN”), and U.S.
Government Agency securities. The Company classifi es the ARS and VRDN
as available-for-sale. Securities accounted for as available-for-sale are
required to be reported at fair value with unrealized gains and losses, net
of taxes, excluded from net income and shown separately as a component
of accumulated other comprehensive income within shareholders’ equity.
The securities that the Company has classifi ed as available-for-sale
generally trade at par and as a result typically do not have any realized
or unrealized gains or losses. No gains or losses were realized on sales
of ARS and VRDN for the years ended December 31, 2007, 2006, and
2005. As of December 31, 2007, there are no unrealized holding gains or
losses on these securities. The Company had $109.9 and $135.4 of ARS
and VRDN classifi ed as short-term investments as of December 31, 2007
and 2006, respectively. All of the Company’s investments in ARS and
VRDN were liquidated at cost as of January 2, 2008.
The U.S. Government Agency securities with original maturities
between six and twelve months are carried at cost, which approximates
market. It is the intent of the Company to hold these investments until
they mature or are called by the issuer.
Inventories
Inventories, consisting primarily of purchased laboratory supplies,
are stated at the lower of cost (fi rst-in, fi rst-out) or market.
Laboratory Corporation of America