LabCorp 2007 Annual Report Download - page 50
Download and view the complete annual report
Please find page 50 of the 2007 LabCorp annual report below. You can navigate through the pages in the report by either clicking on the pages listed below, or by using the keyword search tool below to find specific information within the annual report.-
 1
1 -
2
-
3
-
4
-
5
-
6
-
7
-
8
-
9
-
10
-
11
-
12
-
13
-
14
-
15
-
16
-
17
-
18
-
19
-
20
-
21
-
22
-
23
-
24
-
25
-
26
-
27
-
28
-
29
-
30
-
31
-
32
-
33
-
34
-
35
-
36
-
37
-
38
-
39
-
 40
40 -
 41
41 -
 42
42 -
 43
43 -
 44
44 -
 45
45 -
 46
46 -
 47
47 -
 48
48 -
 49
49 -
 50
50 -
 51
51 -
 52
52 -
 53
53 -
 54
54 -
 55
55 -
 56
56 -
 57
57 -
 58
58 -
 59
59 -
 60
60
 |
 |

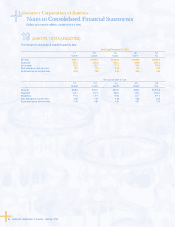
Notes to Consolidated Financial Statements
(Dollars and shares in millions, except per share data)
48 Laboratory Corporation of America® Holdings 2007
STOCK COMPENSATION PLANS
Stock Incentive Plans
There are currently 19.7 million shares authorized for issuance under
the 2000 Stock Incentive Plan, the Amended and Restated 1999 Stock
Incentive Plan and the 1994 Stock Option Plan. Each of these plans
was approved by shareholders. At December 31, 2007, there were
0.5 million additional shares available for grant under the Company’s
stock option plans.
Stock Options
The following table summarizes grants of non-qualifi ed options made
by the Company to offi cers, key employees, and non-employee directors
under all plans. Stock options are generally granted at an exercise
price equal to or greater than the fair market price per share on the
date of grant. Also, for each grant, options vest ratably over a period
of three years on the anniversaries of the grant date, subject to their
earlier expiration or termination.
Changes in options outstanding under the plans for the periods
indicated were as follows:
Weighted-
Weighted- Average
Average Remaining Aggregate
Number of Exercise Price Contractual Intrinsic
Options Per Option Term Value
Outstanding at
December 31, 2006 5.1 $44.10
Granted 1.4 80.34
Exercised (1.7) 38.49
Cancelled (0.1) 64.90
Outstanding at
December 31, 2007 4.7 $56.71 7.3 $94.5
Vested and expected
to vest at
December 31, 2007 4.5 $56.06 7.2 $93.7
Exercisable at
December 31, 2007 2.2 $42.69 5.8 $72.1
The aggregate intrinsic value in the table above represents the
total pre-tax intrinsic value (the difference between the Company’s
closing stock price on the last trading day of 2007 and the exercise
price, multiplied by the number of in-the-money options) that would
have been received by the option holders had all option holders
exercised their options on December 31, 2007. The amount of
intrinsic value will change based on the fair market value of the
Company’s stock.
Cash received by the Company from option exercises, the actual
tax benefi t realized for the tax deductions and the aggregate intrinsic
value of options exercised from option exercises under all share-based
payment arrangements during the years ended December 31, 2007,
2006, and 2005 were as follows:
2007 2006 2005
Cash received by the Company $67.4 $72.9 $49.7
Tax benefi ts realized $25.7 $19.0 $11.0
Aggregate intrinsic value $63.6 $48.0 $27.9
Laboratory Corporation of America