LabCorp 2007 Annual Report Download - page 3
Download and view the complete annual report
Please find page 3 of the 2007 LabCorp annual report below. You can navigate through the pages in the report by either clicking on the pages listed below, or by using the keyword search tool below to find specific information within the annual report.-
 1
1 -
 2
2 -
 3
3 -
 4
4 -
 5
5 -
 6
6 -
 7
7 -
 8
8 -
 9
9 -
 10
10 -
 11
11 -
 12
12 -
 13
13 -
 14
14 -
15
-
16
-
17
-
18
-
19
-
20
-
21
-
22
-
23
-
24
-
25
-
26
-
27
-
28
-
29
-
30
-
31
-
32
-
33
-
34
-
35
-
36
-
37
-
38
-
39
-
40
-
41
-
42
-
43
-
44
-
45
-
46
-
47
-
48
-
49
-
50
-
51
-
52
-
53
-
54
-
55
-
56
-
57
-
58
-
59
-
60
 |
 |

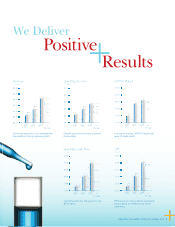
Operating income continued to grow in
double digits.
In a year of change, EBITDA margins still
grew 20 basis points.
Continued execution of our strategic plan
has resulted in strong revenue growth.
EPS has grown due to strong operational
performance and effi cient use of free
cash fl ows.
Operating cash fl ow has grown to over
$700 million.
We Deliver
Laboratory Corporation of America® Holdings 2007 1
Positive Results