Pfizer 2015 Annual Report Download - page 20
Download and view the complete annual report
Please find page 20 of the 2015 Pfizer annual report below. You can navigate through the pages in the report by either clicking on the pages listed below, or by using the keyword search tool below to find specific information within the annual report.-
 1
1 -
2
-
3
-
4
-
5
-
6
-
7
-
8
-
9
-
 10
10 -
 11
11 -
 12
12 -
 13
13 -
 14
14 -
 15
15 -
 16
16 -
 17
17 -
 18
18 -
 19
19 -
 20
20 -
 21
21 -
 22
22 -
 23
23 -
 24
24 -
 25
25 -
 26
26 -
 27
27 -
 28
28 -
 29
29 -
 30
30 -
31
-
32
-
33
-
34
-
35
-
36
-
37
-
38
-
39
-
40
-
41
-
42
-
43
-
44
-
45
-
46
-
47
-
48
-
49
-
50
-
51
-
52
-
53
-
54
-
55
-
56
-
57
-
58
-
59
-
60
-
61
-
62
-
63
-
64
-
65
-
66
-
67
-
68
-
69
-
70
-
71
-
72
-
73
-
74
-
75
-
76
-
77
-
78
-
79
-
80
-
81
-
82
-
83
-
84
-
85
-
86
-
87
-
88
-
89
-
90
-
91
-
92
-
93
-
94
-
95
-
96
-
97
-
98
-
99
-
100
-
101
-
102
-
103
-
104
-
105
-
106
-
107
-
108
-
109
-
110
-
111
-
112
-
113
-
114
-
115
-
116
-
117
-
118
-
119
-
120
-
121
-
122
-
123
-
124
-
125
-
126
-
127
-
128
-
129
-
130
-
131
-
132
-
133
-
134
 |
 |

Financial Review
Pfizer Inc. and Subsidiary Companies
2015 Financial Report
19
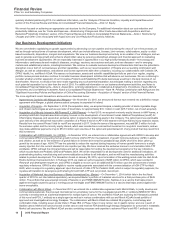
ANALYSIS OF THE CONSOLIDATED STATEMENTS OF INCOME
Year Ended December 31, % Change
(MILLIONS OF DOLLARS) 2015 2014 2013 15/14 14/13
Revenues $48,851 $ 49,605 $ 51,584 (2) (4)
Cost of sales 9,648 9,577 9,586 1—
% of revenues 19.7%19.3%18.6%
Selling, informational and administrative expenses 14,809 14,097 14,355 5(2)
% of revenues 30.3%28.4%27.8%
Research and development expenses 7,690 8,393 6,678 (8) 26
% of revenues 15.7%16.9%12.9%
Amortization of intangible assets 3,728 4,039 4,599 (8) (12)
% of revenues 7.6% 8.1% 8.9%
Restructuring charges and certain acquisition-related
costs 1,152 250 1,182 *(79)
% of revenues 2.4% 0.5% 2.3%
Other (income)/deductions—net 2,860 1,009 (532)**
Income from continuing operations before provision for
taxes on income 8,965 12,240 15,716 (27)(22)
% of revenues 18.4%24.7%30.5%
Provision for taxes on income 1,990 3,120 4,306 (36)(28)
Effective tax rate 22.2%25.5%27.4%
Income from continuing operations 6,975 9,119 11,410 (24)(20)
% of revenues 14.3%18.4%22.1%
Discontinued operations—net of tax 11 48 10,662 (77)*
Net income before allocation to noncontrolling interests 6,986 9,168 22,072 (24)(58)
% of revenues 14.3%18.5%42.8%
Less: Net income attributable to noncontrolling interests 26 32 69 (21)(53)
Net income attributable to Pfizer Inc. $6,960 $9,135 $ 22,003 (24)(58)
% of revenues 14.2%18.4%42.7%
Certain amounts and percentages may reflect rounding adjustments.
* Calculation not meaningful.
Revenues—Overview
Total revenues were $48.9 billion in 2015, a decrease of 2% compared to 2014, which reflects an operational increase of $3.0 billion, or 6%,
more than offset by the unfavorable impact of foreign exchange of $3.8 billion, or 8%, in 2015 compared to 2014. The operational increase
was primarily the result of:
• the performance of several key products in developed markets, including the continued strong uptake of Prevnar 13 among adults (largely
in the U.S.), Ibrance (nearly all in the U.S.), Eliquis, Lyrica (GIP) (primarily in the U.S. and Japan), Xeljanz (primarily in the U.S.), Viagra
(GIP) (primarily in the U.S.) and Nexium 24HR (primarily in the U.S.) (collectively, up approximately $4.1 billion);
• inclusion of legacy Hospira operations of $1.5 billion;
• a 7% operational increase in revenues in emerging markets, reflecting continued strong operational growth, primarily from Prevenar 13,
Lipitor and Enbrel (up approximately $810 million); and
• inclusion of the vaccines acquired from Baxter of $178 million,
partially offset by:
• the loss of exclusivity and immediate multi-source generic competition for Celebrex in the U.S. in December 2014 and certain other
developed markets (down approximately $1.8 billion), and the loss of exclusivity for Lyrica (GEP) in certain developed Europe markets
(down approximately $420 million), for Zyvox in the U.S. (down approximately $420 million), for Rapamune in the U.S. (down
approximately $120 million) and for certain other products (collectively, down approximately $530 million);
• the performance of certain other products in developed markets and BeneFIX in the U.S. (collectively, down approximately $370 million);
and
• the termination of the Spiriva co-promotion collaboration in certain countries (down approximately $100 million).
Total revenues were $49.6 billion in 2014, a decrease of 4% compared to 2013, which reflects an operational decrease of $1.1 billion, or 2%,
and the unfavorable impact of foreign exchange of approximately $912 million, or 2%, in 2014 compared to 2013. The operational decrease
was primarily the result of:
• the expiration of the co-promotion term of the collaboration agreement for Enbrel in the U.S. and Canada (approximately $1.4 billion);