Pfizer 2015 Annual Report Download - page 4
Download and view the complete annual report
Please find page 4 of the 2015 Pfizer annual report below. You can navigate through the pages in the report by either clicking on the pages listed below, or by using the keyword search tool below to find specific information within the annual report.-
 1
1 -
 2
2 -
 3
3 -
 4
4 -
 5
5 -
 6
6 -
 7
7 -
 8
8 -
 9
9 -
 10
10 -
 11
11 -
 12
12 -
 13
13 -
 14
14 -
 15
15 -
16
-
17
-
18
-
19
-
20
-
21
-
22
-
23
-
24
-
25
-
26
-
27
-
28
-
29
-
30
-
31
-
32
-
33
-
34
-
35
-
36
-
37
-
38
-
39
-
40
-
41
-
42
-
43
-
44
-
45
-
46
-
47
-
48
-
49
-
50
-
51
-
52
-
53
-
54
-
55
-
56
-
57
-
58
-
59
-
60
-
61
-
62
-
63
-
64
-
65
-
66
-
67
-
68
-
69
-
70
-
71
-
72
-
73
-
74
-
75
-
76
-
77
-
78
-
79
-
80
-
81
-
82
-
83
-
84
-
85
-
86
-
87
-
88
-
89
-
90
-
91
-
92
-
93
-
94
-
95
-
96
-
97
-
98
-
99
-
100
-
101
-
102
-
103
-
104
-
105
-
106
-
107
-
108
-
109
-
110
-
111
-
112
-
113
-
114
-
115
-
116
-
117
-
118
-
119
-
120
-
121
-
122
-
123
-
124
-
125
-
126
-
127
-
128
-
129
-
130
-
131
-
132
-
133
-
134
 |
 |

Financial Review
Pfizer Inc. and Subsidiary Companies
2015 Financial Report
3
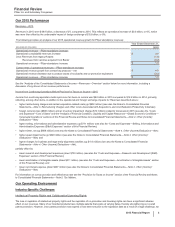
Our 2015 Performance
Revenues––2015
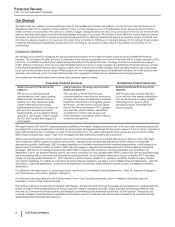
Revenues in 2015 were $48.9 billion, a decrease of 2% compared to 2014. This reflects an operational increase of $3.0 billion, or 6%, which
was more than offset by the unfavorable impact of foreign exchange of $3.8 billion, or 8%.
The following provides an analysis of our 2015 operational revenue growth for Pfizer standalone revenues:
Year Ended December 31,
(BILLIONS OF DOLLARS) 2015
Operational revenues––Pfizer-standalone increase:
Operational consolidated revenues increase $ 3.0
Less: Revenues from legacy Hospira (1.5)
Revenues from vaccines acquired from Baxter (0.2)
Operational revenues––Pfizer-standalone increase $1.3
Components of operational revenues––Pfizer-standalone increase:
Operational revenue growth from certain key products––net $4.5
Operational revenue decrease due to product losses of exclusivity and co-promotion expirations (3.2)
Operational revenues––Pfizer-standalone increase $1.3
See the “Analysis of the Consolidated Statements of Income––Revenues––Overview” section below for more information, including a
discussion of key drivers of our revenue performance.
Income from Continuing Operations Before Provision for Taxes on Income––2015
Income from continuing operations before provision for taxes on income was $9.0 billion in 2015 compared to $12.2 billion in 2014, primarily
reflecting, among other items, in addition to the operational and foreign exchange impacts for Revenues described above:
• higher restructuring charges and certain acquisition-related costs (up $902 million) (see also the Notes to Consolidated Financial
Statements––Note 3. Restructuring Charges and Other Costs Associated with Acquisitions and Cost-Reduction/Productivity Initiatives);
• foreign currency loss ($806 million) and an inventory impairment charge ($72 million) related to Venezuela in 2015 (see also the “Costs
and Expenses––Cost of Sales” and the “Analysis of Financial Condition, Liquidity and Capital Resources––Global Economic Conditions––
Venezuela Operations” sections of this Financial Review and Notes to Consolidated Financial Statements––Note 4. Other (Income)/
Deductions––Net);
• higher selling, informational and administrative expenses (up $711 million) (see also the “Costs and Expenses––Selling, Informational and
Administrative Expenses (SI&A) Expenses” section of this Financial Review);
• higher Other, net (up $668 million) (see also the Notes to Consolidated Financial Statements––Note 4. Other (Income)/Deductions––Net);
• higher asset impairments (up $349 million) (see also the Notes to Consolidated Financial Statements––Note 4. Other (Income)/
Deductions––Net); and
• higher charges for business and legal entity alignment activities (up $114 million) (see also the Notes to Consolidated Financial
Statements––Note 4. Other (Income)/Deductions––Net),
partially offset by:
• lower research and development expenses (down $703 million) (see also the “Costs and Expenses––Research and Development (R&D)
Expenses” section of this Financial Review);
• lower amortization of intangible assets (down $311 million) (see also the “Costs and Expenses––Amortization of Intangible Assets” section
of this Financial Review); and
• lower net interest expense (down $207 million) (see also the Notes to Consolidated Financial Statements––Note 4. Other (Income)/
Deductions––Net).
For information on our tax provision and effective tax rate see the “Provision for Taxes on Income” section of the Financial Review and Notes
to Consolidated Financial Statements––Note 5. Tax Matters.
Our Operating Environment
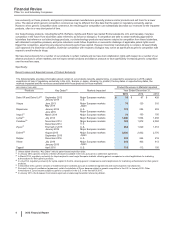
Industry-Specific Challenges
Intellectual Property Rights and Collaboration/Licensing Rights
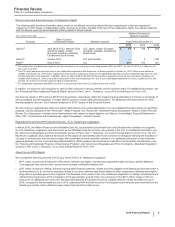
The loss or expiration of intellectual property rights and the expiration of co-promotion and licensing rights can have a significant adverse
effect on our revenues. Many of our branded products have multiple patents that expire at varying dates, thereby strengthening our overall
patent protection. However, once patent protection has expired or has been lost prior to the expiration date as a result of a legal challenge, we