Tesco 2010 Annual Report Download - page 2
Download and view the complete annual report
Please find page 2 of the 2010 Tesco annual report below. You can navigate through the pages in the report by either clicking on the pages listed below, or by using the keyword search tool below to find specific information within the annual report.-
 1
1 -
 2
2 -
 3
3 -
 4
4 -
 5
5 -
 6
6 -
 7
7 -
 8
8 -
 9
9 -
 10
10 -
 11
11 -
 12
12 -
 13
13 -
14
-
15
-
16
-
17
-
18
-
19
-
20
-
21
-
22
-
23
-
24
-
25
-
26
-
27
-
28
-
29
-
30
-
31
-
32
-
33
-
34
-
35
-
36
-
37
-
38
-
39
-
40
-
41
-
42
-
43
-
44
-
45
-
46
-
47
-
48
-
49
-
50
-
51
-
52
-
53
-
54
-
55
-
56
-
57
-
58
-
59
-
60
-
61
-
62
-
63
-
64
-
65
-
66
-
67
-
68
-
69
-
70
-
71
-
72
-
73
-
74
-
75
-
76
-
77
-
78
-
79
-
80
-
81
-
82
-
83
-
84
-
85
-
86
-
87
-
88
-
89
-
90
-
91
-
92
-
93
-
94
-
95
-
96
-
97
-
98
-
99
-
100
-
101
-
102
-
103
-
104
-
105
-
106
-
107
-
108
-
109
-
110
-
111
-
112
-
113
-
114
-
115
-
116
-
117
-
118
-
119
-
120
-
121
-
122
-
123
-
124
-
125
-
126
-
127
-
128
-
129
-
130
-
131
-
132
-
133
-
134
-
135
-
136
 |
 |

2008/9‡
52 weeks ended 27 February 2010 2009/10 52 weeks 53 weeks
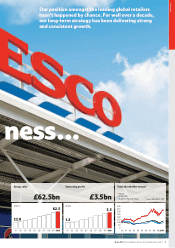
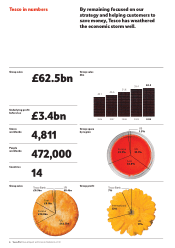
Group sales (£m) (including VAT)* 62,537 58,570 59,426
Group revenue (£m) (excluding VAT) 56,910 53,115 53,898
Group trading profit (£m) 3,412 3,039 3,086
Underlying profit before tax (£m) 3,395 3,083 3,124
Group profit before tax (£m) 3,176 2,876 2,917
Underlying diluted earnings
per share (p) 31.66 28.50 28.87
Dividend per share (p) 13.05 – 11.96
Group enterprise value (£bn)
(market capitalisation plus net debt) 41.4 – 35.9
Return on capital employed 12.1% – 12.8%
* Group sales (inc. VAT) excludes the accounting impact of IFRIC 13 (Customer Loyalty Programmes).
** Growth in underlying diluted EPS calculated on a constant tax rate basis.
‡ Restated for the impact of IFRIC 13 and IFRS 2.
www.tesco.com/annualreport2010
Financial highlights
All growth figures reported on a 52-week basis.
Group sales
(including VAT)*+6.8%
Underlying profit
before tax +10.1%
Group profit
before tax +10.4%
Underlying diluted
earnings per share** +9.1%
Diluted earnings
per share +9.8%
Dividend
per share +9.1%
Overview
Chairman’s statement 1
A business for a new decade 2
Tesco at a glance 6
Chief Executive’s review 8
Report of the Directors
Our business 9
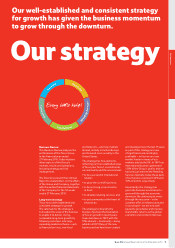
Our strategy 9
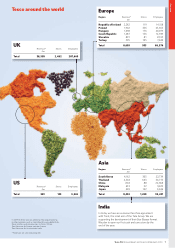
International 10
Core UK 16
Non-food 20
Retailing Services 24
Community 28
Our people 32
Our Board of Directors 36
Key performance indicators 38
Group financials 40
Risks and uncertainties 41
General information 45
Corporate governance 46
Remuneration report 52
Financial statements 67
Statement of Directors’ responsibilities 68
Independent auditors’ report to the
members of Tesco PLC 69
Group income statement 70
Group statement of comprehensive income 71
Group balance sheet 72
Group statement of changes in equity 73
Group cash flow statement 74
Reconciliation of net cash flow to movement in 74
net debt note
Notes to the Group financial statements 75
Five year record 121
Tesco PLC – Parent Company balance sheet 122
Notes to the Parent Company financial statements 123
Independent auditors’ report to the members of
Tesco PLC 131
Financial calendar 132
Contents