Tesco 2010 Annual Report Download - page 94
Download and view the complete annual report
Please find page 94 of the 2010 Tesco annual report below. You can navigate through the pages in the report by either clicking on the pages listed below, or by using the keyword search tool below to find specific information within the annual report.-
 1
1 -
2
-
3
-
4
-
5
-
6
-
7
-
8
-
9
-
10
-
11
-
12
-
13
-
14
-
15
-
16
-
17
-
18
-
19
-
20
-
21
-
22
-
23
-
24
-
25
-
26
-
27
-
28
-
29
-
30
-
31
-
32
-
33
-
34
-
35
-
36
-
37
-
38
-
39
-
40
-
41
-
42
-
43
-
44
-
45
-
46
-
47
-
48
-
49
-
50
-
51
-
52
-
53
-
54
-
55
-
56
-
57
-
58
-
59
-
60
-
61
-
62
-
63
-
64
-
65
-
66
-
67
-
68
-
69
-
70
-
71
-
72
-
73
-
74
-
75
-
76
-
77
-
78
-
79
-
80
-
81
-
82
-
83
-
 84
84 -
 85
85 -
 86
86 -
 87
87 -
 88
88 -
 89
89 -
 90
90 -
 91
91 -
 92
92 -
 93
93 -
 94
94 -
 95
95 -
 96
96 -
 97
97 -
 98
98 -
 99
99 -
 100
100 -
 101
101 -
 102
102 -
 103
103 -
 104
104 -
105
-
106
-
107
-
108
-
109
-
110
-
111
-
112
-
113
-
114
-
115
-
116
-
117
-
118
-
119
-
120
-
121
-
122
-
123
-
124
-
125
-
126
-
127
-
128
-
129
-
130
-
131
-
132
-
133
-
134
-
135
-
136
 |
 |

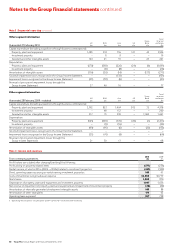
Notes to the Group financial statements continued
Note 11 Property, plant and equipment
Land and
buildings Other(a) Total
£m £m £m
Cost
At 28 February 2009 22,349 7,495 29,844
Foreign currency translation 793 234 1,027
Additions(b) 2,189 735 2,924
Transfers (279) 71 (208)
Classified as held for sale 2 4 6
Disposals (1,669) (141) (1,810)
At 27 February 2010 23,385 8,398 31,783
Accumulated depreciation and impairment losses
At 28 February 2009 2,540 4,152 6,692
Foreign currency translation 80 121 201
Charge for the year 354 737 1,091
Transfers (34) (48) (82)
Classified as held for sale (39) 1 (38)
Disposals (178) (83) (261)
Impairment losses 51 – 51
Reversal of impairment losses (74) – (74)
At 27 February 2010 2,700 4,880 7,580
Net carrying value(c)(d)(e)
At 27 February 2010 20,685 3,518 24,203
At 28 February 2009 19,809 3,343 23,152
Capital work in progress included above(f )
At 27 February 2010 1,652 193 1,845
(a) Other assets consist of plant, equipment, fixtures and fittings and motor vehicles.
(b) Includes £155m (2009 – £152m) in respect of interest capitalised, principally relating
to land and building assets. The capitalisation rate used to determine the amount of
finance costs capitalised during the year was 5.1% (2009 – 5.1%). Interest capitalised
is deducted in determining taxable profit in the year in which it is incurred.
(c) Net carrying value includes:
(i) Capitalised interest at 27 February 2010 of £805m (2009 – £910m).
(ii) Assets held under finance leases which are analysed below:
2010 2009
Land and Land and
buildings Other(a) buildings Other(a)
£m £m £m £m
Cost 139 582 121 578
Accumulated depreciation
and impairment losses (36) (430) (22) (390)
Net carrying value 103 152 99 188
These assets are pledged as security for the finance lease liabilities.
(d) The net carrying value of land and buildings comprises:
2010 2009
£m £m
Freehold 17,855 17,332
Long leasehold – 50 years or more 971 1,450
Short leasehold – less than 50 years 1,859 1,027
Net carrying value 20,685 19,809
(e) Carrying value of land and buildings includes £3m (2009 – £4m) relating to the
prepayment of lease premiums.
(f) Capital work in progress does not include land.
92 Tesco PLC Annual Report and Financial Statements 2010