Tesco 2010 Annual Report Download - page 41
Download and view the complete annual report
Please find page 41 of the 2010 Tesco annual report below. You can navigate through the pages in the report by either clicking on the pages listed below, or by using the keyword search tool below to find specific information within the annual report.-
 1
1 -
2
-
3
-
4
-
5
-
6
-
7
-
8
-
9
-
10
-
11
-
12
-
13
-
14
-
15
-
16
-
17
-
18
-
19
-
20
-
21
-
22
-
23
-
24
-
25
-
26
-
27
-
28
-
29
-
30
-
 31
31 -
 32
32 -
 33
33 -
 34
34 -
 35
35 -
 36
36 -
 37
37 -
 38
38 -
 39
39 -
 40
40 -
 41
41 -
 42
42 -
 43
43 -
 44
44 -
 45
45 -
 46
46 -
 47
47 -
 48
48 -
 49
49 -
 50
50 -
 51
51 -
52
-
53
-
54
-
55
-
56
-
57
-
58
-
59
-
60
-
61
-
62
-
63
-
64
-
65
-
66
-
67
-
68
-
69
-
70
-
71
-
72
-
73
-
74
-
75
-
76
-
77
-
78
-
79
-
80
-
81
-
82
-
83
-
84
-
85
-
86
-
87
-
88
-
89
-
90
-
91
-
92
-
93
-
94
-
95
-
96
-
97
-
98
-
99
-
100
-
101
-
102
-
103
-
104
-
105
-
106
-
107
-
108
-
109
-
110
-
111
-
112
-
113
-
114
-
115
-
116
-
117
-
118
-
119
-
120
-
121
-
122
-
123
-
124
-
125
-
126
-
127
-
128
-
129
-
130
-
131
-
132
-
133
-
134
-
135
-
136
 |
 |

Tesco PLC Annual Report and Financial Statements 2010 39
Our business
2010 2009 2008
Total shareholder return 9.5% 8.0% 22.8%
Total shareholder return is the notional return from a share and is measured as the percentage change in the share price,
plus the dividend paid. This is measured over the last five years.
Full year dividend per share 13.05p 11.96p 10.09p
The dividend is paid in two instalments.
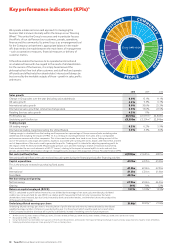
We monitor a wide range of KPIs, both financial and non-financial. Individual business units have their own versions of the Steering Wheel which
incorporate their own priorities and KPIs. Some of the Group KPIs below are tracked through the Steering Wheel and those above are tracked as
a monitor of investor return.
Across the Group, KPIs are set for local markets, with oversight from the Executive Directors, to ensure they are tailored to drive the priorities
of each business.
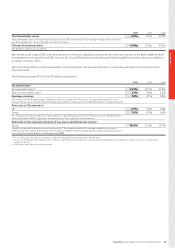
The following are some KPIs for the UK and Group operations:
2010 2009 2008
UK market share
Grocery market share*** 22.5% 22.2% 21.8%
New non-food market share†4.1% 3.6% 3.5%
Employee retention 90% 87% 84%
This measure shows the percentage of employees who have stayed with the business for longer than one year. It is one
measure that we use to monitor employee loyalty and satisfaction and we aim to exceed 80% retention of experienced staff.
Reduction in CO2 emissions††
UK 6.9% 3.6% 3.6%
Group 7.8% 4.8% 4.6%
This measure shows the overall year-on-year reduction in greenhouse gas emissions from existing stores and distribution
centres built before 2006/7, adjusted to exclude emissions from acquisitions and extensions.
Reduction in CO2 emissions intensity of new stores and distribution centres††
Group 28.8% 25.3% 14.7%
Intensity is measured as greenhouse gas emissions/sq ft. The measure indicates the average reduction in emissions
intensity of all new stores and distribution centres built since 2006/7 (the base year). Carbon footprint reporting has been
assured by Environmental Resources Management (ERM).
*** This is measured as the share of all spend by all shoppers through Kantar Worldpanel (Total Till Roll) data.
† Source: Verdict Research, Non-food in Grocers. ‘New non-food’ defined as non-food retail sales excluding Household and Health & Beauty categories. All figures are reported on
a calendar year basis.
†† 2009 figures adjusted for 52-week comparison.