Verizon Wireless 2012 Annual Report Download - page 2
Download and view the complete annual report
Please find page 2 of the 2012 Verizon Wireless annual report below. You can navigate through the pages in the report by either clicking on the pages listed below, or by using the keyword search tool below to find specific information within the annual report.-
 1
1 -
 2
2 -
 3
3 -
 4
4 -
 5
5 -
 6
6 -
 7
7 -
 8
8 -
 9
9 -
 10
10 -
 11
11 -
 12
12 -
 13
13 -
14
-
15
-
16
-
17
-
18
-
19
-
20
-
21
-
22
-
23
-
24
-
25
-
26
-
27
-
28
-
29
-
30
-
31
-
32
-
33
-
34
-
35
-
36
-
37
-
38
-
39
-
40
-
41
-
42
-
43
-
44
-
45
-
46
-
47
-
48
-
49
-
50
-
51
-
52
-
53
-
54
-
55
-
56
-
57
-
58
-
59
-
60
-
61
-
62
-
63
-
64
-
65
-
66
-
67
-
68
-
69
-
70
-
71
-
72
-
73
-
74
-
75
-
76
-
77
-
78
-
79
-
80
-
81
-
82
-
83
-
84
-
85
-
86
-
87
-
88
 |
 |

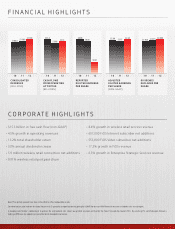
•$15.3billioninfreecashflow(non-GAAP)
•4.5%growthinoperatingrevenues
•13.2%totalshareholderreturn
•3.0%annualdividendincrease
•5.9millionwirelessretailconnectionnetadditions
•0.91%wirelessretailpostpaidchurn
•8.4%growthinwirelessretailservicerevenue
•607,000FiOSInternetsubscribernetadditions
•553,000FiOSVideosubscribernetadditions
•17.2%growthinFiOSrevenue
•6.3%growthinEnterpriseStrategicServicesrevenue
CORPORATE HIGHLIGHTS
FINANCIAL HIGHLIGHTS
Note: Prior-period amounts have been reclassified to reflect comparable results.
See www.verizon.com/investor for reconciliations to U.S. generally accepted accounting principles (GAAP) for the non-GAAP financial measures included in this annual report.
In keeping with Verizon’s commitment to protect the environment, this report was printed on paper certified by the Forest Stewardship Council (FSC). By selecting FSC-certified paper, Verizon is
making a difference by supporting responsible forest management practices.
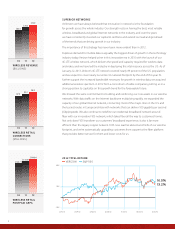
$106.6 $110.9 $115.8
CONSOLIDATED
REVENUES
(BILLIONS)
$33.4
$29.8 $31.5
CASH FLOWS
FROM OPERATING
ACTIVITIES
(BILLIONS)
$0.90 $0.85
$0.31
REPORTED
DILUTED EARNINGS
PER SHARE
$2.20 $2.15 $2.24
ADJUSTED
DILUTED EARNINGS
PER SHARE
(NON-GAAP)
$1.925 $1.975 $2.030
DIVIDENDS
DECLARED PER
SHARE