Verizon Wireless 2012 Annual Report Download - page 80
Download and view the complete annual report
Please find page 80 of the 2012 Verizon Wireless annual report below. You can navigate through the pages in the report by either clicking on the pages listed below, or by using the keyword search tool below to find specific information within the annual report.-
 1
1 -
2
-
3
-
4
-
5
-
6
-
7
-
8
-
9
-
10
-
11
-
12
-
13
-
14
-
15
-
16
-
17
-
18
-
19
-
20
-
21
-
22
-
23
-
24
-
25
-
26
-
27
-
28
-
29
-
30
-
31
-
32
-
33
-
34
-
35
-
36
-
37
-
38
-
39
-
40
-
41
-
42
-
43
-
44
-
45
-
46
-
47
-
48
-
49
-
50
-
51
-
52
-
53
-
54
-
55
-
56
-
57
-
58
-
59
-
60
-
61
-
62
-
63
-
64
-
65
-
66
-
67
-
68
-
69
-
 70
70 -
 71
71 -
 72
72 -
 73
73 -
 74
74 -
 75
75 -
 76
76 -
 77
77 -
 78
78 -
 79
79 -
 80
80 -
 81
81 -
 82
82 -
 83
83 -
 84
84 -
 85
85 -
 86
86 -
 87
87 -
 88
88
 |
 |

78
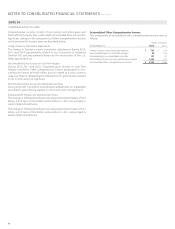
NOTES TO CONSOLIDATED FINANCIAL STATEMENTS continued
(dollars in millions)
2011 Verizon Wireless Wireline Total Segments
External Operating Revenues
Retail service $ 56,601 $ – $ 56,601
Other service 2,497 – 2,497
Service revenue 59,098 – 59,098
Equipment 7,446 – 7,446
Other 3,517 – 3,517
Consumer retail – 13,605 13,605
Small business – 2,720 2,720
Mass Markets – 16,325 16,325
Strategic services – 7,607 7,607
Core – 8,014 8,014
Global Enterprise – 15,621 15,621
Global Wholesale – 6,795 6,795
Other – 704 704
Intersegment revenues 93 1,237 1,330
Total operating revenues 70,154 40,682 110,836
Cost of services and sales 24,086 22,158 46,244
Selling, general and administrative expense 19,579 9,107 28,686
Depreciation and amortization expense 7,962 8,458 16,420
Total operating expenses 51,627 39,723 91,350
Operating income $ 18,527 $ 959 $ 19,486
Assets $ 147,378 $ 86,185 $ 233,563
Plant, property and equipment, net 33,451 54,149 87,600
Capital expenditures 8,973 6,399 15,372
(dollars in millions)
2010 Verizon Wireless Wireline Total Segments
External Operating Revenues
Retail service $ 53,267 $ – $ 53,267
Other service 2,321 – 2,321
Service revenue 55,588 – 55,588
Equipment 4,412 – 4,412
Other 3,341 – 3,341
Consumer retail – 13,419 13,419
Small business – 2,828 2,828
Mass Markets – 16,247 16,247
Strategic services – 6,602 6,602
Core – 8,712 8,712
Global Enterprise – 15,314 15,314
Global Wholesale – 7,526 7,526
Other – 858 858
Intersegment revenues 66 1,282 1,348
Total operating revenues 63,407 41,227 104,634
Cost of services and sales 19,245 22,618 41,863
Selling, general and administrative expense 18,082 9,372 27,454
Depreciation and amortization expense 7,356 8,469 15,825
Total operating expenses 44,683 40,459 85,142
Operating income $ 18,724 $ 768 $ 19,492
Assets $ 138,863 $ 83,849 $ 222,712
Plant, property and equipment, net 32,253 54,594 86,847
Capital expenditures 8,438 7,269 15,707