Walgreens 2005 Annual Report Download - page 22
Download and view the complete annual report
Please find page 22 of the 2005 Walgreens annual report below. You can navigate through the pages in the report by either clicking on the pages listed below, or by using the keyword search tool below to find specific information within the annual report.-
 1
1 -
2
-
3
-
4
-
5
-
6
-
7
-
8
-
9
-
10
-
11
-
 12
12 -
 13
13 -
 14
14 -
 15
15 -
 16
16 -
 17
17 -
 18
18 -
 19
19 -
 20
20 -
 21
21 -
 22
22 -
 23
23 -
 24
24 -
 25
25 -
 26
26 -
 27
27 -
 28
28 -
 29
29 -
 30
30 -
 31
31 -
 32
32 -
33
-
34
-
35
-
36
-
37
-
38
 |
 |

Management’s Discussion and Analysis of Results of Operations
and Financial Condition
Results of Operations
Fiscal 2005 was the 31st consecutive year of record sales and earnings. Fiscal
year net earnings increased 15.5% to $1.560 billion, or $1.52 per share (diluted),
versus last year’s earnings of $1.350 billion, or $1.31 per share (diluted). Net
earnings increases resulted from improved sales and higher gross profit margins,
partially offset by higher expense ratios.
In the fourth quarter of fiscal year 2005, the company recorded $54.7 million
($.03 per share, diluted) of pre-tax expenses related to Hurricane Katrina.
These expenses included an estimated $32.8 million of inventory losses, an
estimated $14.8 million of present value lease obligations for temporary, as
well as permanent, store closings and an estimated $5.2 million in equipment
losses. Fiscal year 2005 also included pre-tax litigation settlement gains of
$26.3 million ($.02 per share, diluted) compared to similar settlements of
$16.3 million ($.01 per share, diluted) last fiscal year.
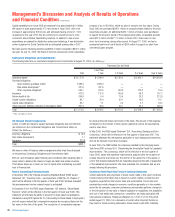
The following table illustrates the effects of Hurricane Katrina expenses and
litigation settlement gains on the company’s earnings. The non-GAAP disclosure
of earnings is not preferable to GAAP net earnings but is shown as a supplement
to such disclosure for comparability to the prior year’s earnings.
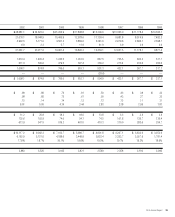
Year Ended August 31,
2005 2004 % Change
Earnings excluding the effect of
Hurricane Katrina expenses and
litigation settlement gains $ 1,577.3 $ 1,339.6 17.7
Diluted earnings per share $1.53 $ 1.30 17.7
Earnings effect of Hurricane
Katrina expenses (34.3) —
Diluted earnings per share (.03) —
Earnings effect of litigation
settlement gains 16.5 10.2
Diluted earnings per share .02 .01
Net earnings $ 1,559.5 $ 1,349.8 15.5
Diluted net earnings per share $1.52 $ 1.31 16.0
Net sales increased by 12.5% to $42.202 billion in fiscal 2005 compared to
increases of 15.4% in 2004 and 13.3% in 2003. Drugstore sales increases resulted
from sales gains in existing stores and added sales from new stores, each of
which includes an indeterminate amount of market-driven price changes. Sales in
comparable drugstores were up 8.2% in 2005, 10.9% in 2004 and 8.6% in 2003.
Comparable stores are defined as those that have been open for at least twelve
consecutive months without closure for seven or more consecutive days and
without a major remodel or a natural/economic disaster in the past twelve
months. Relocated stores are not included as comparable stores for the first
twelve months after the relocation. The company operated 4,953 drugstores
as of August 31, 2005, compared to 4,582 as of August 31, 2004, and 4,227
at August 31, 2003.
Prescription sales increased 13.4% in 2005, 17.8% in 2004 and 17.4% in 2003.
Comparable drugstore prescription sales were up 9.8% in 2005, 14.0% in 2004
and 13.2% in 2003. Prescription sales were 63.7% of total net sales for fiscal
2005 compared to 63.2% in 2004 and 62.0% in 2003. The effect of generic
drugs, which have a lower retail price, replacing brand name drugs reduced
prescription sales by 2.4% for 2005, 1.2% for 2004 and 2.1% for 2003. The shift
of Prilosec in September 2003 to over-the-counter status and its related effect
on Omeprazole (generic Prilosec) also reduced fiscal 2004 prescription sales.
Introduction
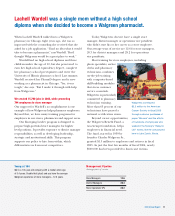
Walgreens is a retail drugstore chain that sells prescription and non-prescription
drugs and general merchandise. General merchandise includes, among other
things, cosmetics, toiletries, food, beverages, household items and photofinishing.
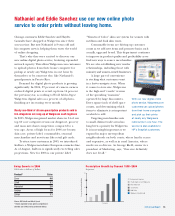
Customers can have prescriptions filled at the drugstore counter, as well as through
the mail, by telephone and on the Internet. As of August 31, 2005, we operated
4,953 drugstores (including three mail service facilities, as well as stores closed
as of August 31, 2005, due to Hurricane Katrina) in 45 states and Puerto Rico.
The drugstore industry is highly competitive. In addition to other drugstore chains,
independent drugstores, mail order prescription providers and Internet pharmacies,
we also compete with various other retailers including grocery stores, mass
merchants and dollar stores.
The long-term outlook for prescription sales is strong due in part to the aging
population, as well as the continued development of innovative drugs that improve
quality of life and control healthcare costs. As of January 1, 2006, the new Medicare
Part D prescription drug program will be in effect. While it is difficult to fully predict
the business impact, we believe we are well positioned to capture additional
Medicare prescription sales. During fiscal year 2005, the precursor to this program,
the Medicare senior discount cards, gave us additional prescription sales, although
the gross margin rates on these sales were lower.
We continue to expand into new markets and increase penetration in existing
markets. To support our growth, we are also investing significantly in prime
locations, technology and customer service initiatives.
Reclassification of Financial Statements
Litigation settlement gains, which were previously classified as Other Income, have
been reclassified as reductions to selling, occupancy and administration expenses.
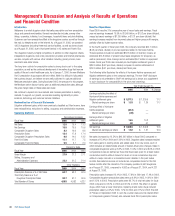
Operating Statistics
Percentage Increases
Fiscal Year 2005 2004 2003
Net Sales 12.5 15.4 13.3
Net Earnings 15.5 15.9 15.6
Comparable Drugstore Sales 8.2 10.9 8.6
Prescription Sales 13.4 17.8 17.4
Comparable Drugstore Prescription Sales 9.8 14.0 13.2
Front-End Sales 11.1 11.7 7.5
Comparable Front-End Sales 5.5 6.1 2.0
Percent to Sales
Fiscal Year 2005 2004 2003
Gross Margin 27.9 27.2 27.1
Selling, Occupancy and
Administration Expenses 22.2 21.5 21.4
Other Statistics
Fiscal Year 2005 2004 2003
Prescription Sales as a % of Net Sales 63.7 63.2 62.0
Third Party Sales as a % of
Drugstore Prescription Sales 92.7 91.7 90.6
Total Number of Stores 4,953 4,582 4,227
20 2005 Annual Report