Walgreens 2005 Annual Report Download - page 30
Download and view the complete annual report
Please find page 30 of the 2005 Walgreens annual report below. You can navigate through the pages in the report by either clicking on the pages listed below, or by using the keyword search tool below to find specific information within the annual report.-
 1
1 -
2
-
3
-
4
-
5
-
6
-
7
-
8
-
9
-
10
-
11
-
12
-
13
-
14
-
15
-
16
-
17
-
18
-
19
-
 20
20 -
 21
21 -
 22
22 -
 23
23 -
 24
24 -
 25
25 -
 26
26 -
 27
27 -
 28
28 -
 29
29 -
 30
30 -
 31
31 -
 32
32 -
 33
33 -
 34
34 -
 35
35 -
 36
36 -
 37
37 -
 38
38
 |
 |

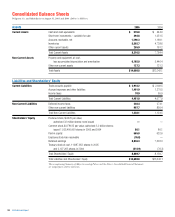
Notes to Consolidated Financial Statements
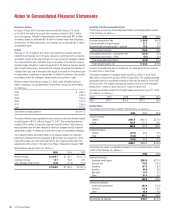
Hurricane Katrina
In August of fiscal 2005, Hurricane Katrina forced the closing of 74 stores
in the Gulf Coast states. As a result, the company provided for $54.7 million
of pre-tax expenses. Included in these expenses were an estimated $32.8 million
of inventory losses, an estimated $14.8 million of present value lease obligations
for temporary, as well as permanent, store closings and an estimated $5.2 million
of equipment losses.
Leases
Although 17.7% of locations are owned, the remainder are leased premises.
Initial terms are typically 20 to 25 years, followed by additional terms containing
cancellation options at five-year intervals, and may include rent escalation clauses.
The commencement date of all lease terms is the earlier of the date the company
becomes legally obligated to make rent payments or the date the company has the
right to control the property. Additionally, the company recognizes rent expense on
a straight-line basis over a time period that equals or exceeds the time period used
for depreciation of buildings on leased land. In addition to minimum fixed rentals,
most leases provide for contingent rentals based upon a portion of sales.
Minimum rental commitments at August 31, 2005, under all leases having an
initial or remaining non-cancelable term of more than one year are shown below
(In Millions):
2006 $ 1,390.4
2007 1,435.6
2008 1,396.3
2009 1,370.3
2010 1,346.9
Later 17,173.0
Total minimum lease payments $ 24,112.5
The above minimum lease payments include minimum rental commitments related
to capital leases of $74.3 million at August 31, 2005. This capital lease amount
includes $34.6 million of executory costs and imputed interest. Total minimum
lease payments have not been reduced by minimum sublease rentals of approxi-
mately $49.5 million on leases due in the future under non-cancelable subleases.
The company remains secondarily liable on 24 assigned leases. The maximum
potential of undiscounted future payments is $6.5 million as of August 31, 2005.
Lease option dates vary with some extending to 2013. Approximately half of the
assignments were a result of the sale of the “Wag’s” restaurants in August 1988.
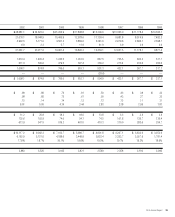
Rental expense was as follows (In Millions):
2005 2004 2003
Minimum rentals $1,300.7 $1,152.1 $1,017.4
Contingent rentals 18.7 20.3 22.1
Less: Sublease rental income (12.5) (11.9) (12.1)
$1,306.9 $1,160.5 $1,027.4
Goodwill and Other Intangible Assets
The carrying amount and accumulated amortization of intangible assets consists
of the following (In Millions):
2005 2004
Purchased prescription files $ 86.9 $ 64.8
Other amortizable intangible assets 21.7 18.9
Nonamortizable intangible assets – goodwill 10.3 10.3
Gross carrying amount 118.9 94.0
Accumulated amortization – prescription files (25.6) (12.4)
Accumulated amortization – other (9.3) (8.0)
Total accumulated amortization (34.9) (20.4)
Total intangible assets, net $ 84.0 $ 73.6
Goodwill is evaluated annually for impairment. No impairment loss has occurred
for fiscal 2005 or fiscal 2004.
Amortization expense for intangible assets was $18.5 million in fiscal 2005,
$8.8 million in fiscal 2004 and $6.3 million in fiscal 2003. The weighted-average
amortization period for purchased prescription files was five years for fiscal 2005
and fiscal 2004. The weighted-average amortization periods for other intangible
assets were 11 years for fiscal 2005 and 13 years for fiscal 2004.
Expected amortization expense for intangible assets recorded at August 31, 2005,
is as follows (In Millions):
2006 2007 2008 2009 2010
$20.5 $18.7 $16.0 $12.3 $3.2
Income Taxes
The provision for income taxes consists of the following (In Millions):
2005 2004 2003
Current provision –
Federal $841.4 $632.5 $574.0
State 125.5 111.4 80.1
966.9 743.9 654.1
Deferred provision –
Federal (57.8) 65.3 42.5
State (13.0) .7 10.0
(70.8) 66.0 52.5
$896.1 $809.9 $706.6
The deferred tax assets and liabilities included in the Consolidated Balance Sheets
consist of the following (In Millions):
2005 2004
Deferred tax assets –
Employee benefit plans $263.5 $212.0
Accrued rent 118.5 106.0
Insurance 157.5 136.0
Inventory 40.8 39.6
Bad debt 14.3 15.4
Other 61.4 29.4
656.0 538.4
Deferred tax liabilities –
Accelerated depreciation 663.4 621.5
Inventory 112.8 115.1
Other 25.9 18.6
802.1 755.2
Net deferred tax liabilities $146.1 $216.8
28 2005 Annual Report