Walgreens 2005 Annual Report Download - page 3
Download and view the complete annual report
Please find page 3 of the 2005 Walgreens annual report below. You can navigate through the pages in the report by either clicking on the pages listed below, or by using the keyword search tool below to find specific information within the annual report.-
 1
1 -
 2
2 -
 3
3 -
 4
4 -
 5
5 -
 6
6 -
 7
7 -
 8
8 -
 9
9 -
 10
10 -
 11
11 -
 12
12 -
 13
13 -
 14
14 -
15
-
16
-
17
-
18
-
19
-
20
-
21
-
22
-
23
-
24
-
25
-
26
-
27
-
28
-
29
-
30
-
31
-
32
-
33
-
34
-
35
-
36
-
37
-
38
 |
 |

Financial Highlights
For the years ended August 31, 2005 and 2004 (In Millions, except per share data)
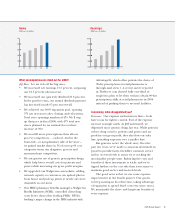
2005 2004 Increase
Net Sales $ 42,201.6 $ 37,508.2 12.5%
Net Earnings $ 1,559.5 $ 1,349.8 15.5%
Net Earnings per Common Share (diluted) $ 1.52 $ 1.31 16.0%
Shareholders’ Equity $ 8,889.7 $ 8,139.7 9.2%
Return on Average Shareholders’ Equity 18.3% 17.7%
Closing Stock Price per Common Share $ 46.33 $ 36.45
Total Market Value of Common Stock $ 46,956.0 $ 37,299.0
Dividends Declared per Common Share $ .22 $.18
Average Shares Outstanding (diluted) 1,028.3 1,031.8
2005 Annual Report 1
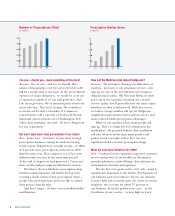
2005 2004 2003 2002 2001
Drugstores Openings
New Stores 432 425 430 471 473
Acquisitions 311 — — 1
Closings 64 81 86 108 119
Net Openings 371 355 344 363 355
Stores
(1)
4,953 4,582 4,227 3,883 3,520
Sales Area
(2)
55,387 50,927 46,734 42,672 38,226
Product Class Sales Prescription Drugs 64% 63% 62% 60% 58%
Non-prescription Drugs
(3)
11% 12% 12% 11% 12%
General Merchandise
(3)
25% 25% 26% 29% 30%
(1) Includes 29 pharmacy-only locations, three mail service facilities
and stores closed as of August 31, 2005, due to Hurricane Katrina.
(2) In thousands of square feet.
(3) Based on store scanning information.
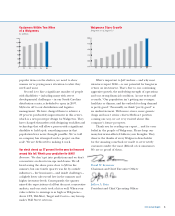
Company Highlights
Walgreens Stock Performance
Fiscal year-end closing price per share in dollars
Prices are adjusted for two-for-one stock splits in 1999 and 1997