Walgreens 2005 Annual Report Download - page 33
Download and view the complete annual report
Please find page 33 of the 2005 Walgreens annual report below. You can navigate through the pages in the report by either clicking on the pages listed below, or by using the keyword search tool below to find specific information within the annual report.-
 1
1 -
2
-
3
-
4
-
5
-
6
-
7
-
8
-
9
-
10
-
11
-
12
-
13
-
14
-
15
-
16
-
17
-
18
-
19
-
20
-
21
-
22
-
 23
23 -
 24
24 -
 25
25 -
 26
26 -
 27
27 -
 28
28 -
 29
29 -
 30
30 -
 31
31 -
 32
32 -
 33
33 -
 34
34 -
 35
35 -
 36
36 -
 37
37 -
 38
38
 |
 |

2005 Annual Report 31
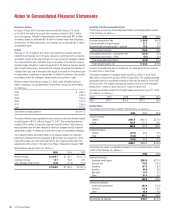
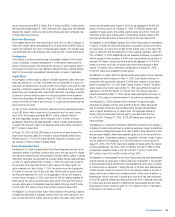
The measurement date used to determine the postretirement benefits is as of
the fiscal year ending August 31. The discount rate assumption used to compute
the postretirement benefit obligation at year-end was 5.5% for 2005 and 6.5%
for 2004. The discount rate assumption used to determine net periodic benefit
cost was 5.5% for 2005, 6.5% for 2004 and 7.0% for 2003.
Future benefit costs were estimated assuming medical costs would increase at a
10.0% annual rate gradually decreasing to 5.25% over the next five years and then
remaining at a 5.25% annual growth rate thereafter. A one percentage point change in
the assumed medical cost trend rate would have the following effects (In Millions):
1% Increase 1% Decrease
Effect on service and interest cost $13.3 $ (6.9)
Effect on postretirement obligation 27.8 (24.6)
Estimated Estimated
Future Benefit Federal
(In Millions) Payments Subsidy
2006 $ 6.9 $ .5
2007 8.3 1.0
2008 9.2 1.1
2009 10.6 1.3
2010 12.4 1.5
2011-2015 86.3 11.4
The expected contribution to be paid during fiscal year 2006 is $6.4 million.
The company’s accumulated postretirement benefit obligation (APBO) and net periodic
benefit costs include the effect of the federal subsidy provided by the Medicare
Prescription Drug Improvement and Modernization Act of 2003. The APBO and
net periodic benefit costs have decreased by approximately $115.4 million and
$6.5 million, respectively.
Supplementary Financial Information
Included in the Consolidated Balance Sheets captions are the following assets
and liabilities (In Millions):
2005 2004
Accounts receivable –
Accounts receivable $1,441.6 $1,197.4
Allowance for doubtful accounts (45.3) (28.3)
$1,396.3 $1,169.1
Accrued expenses and other liabilities –
Accrued salaries $ 516.6 $ 465.3
Taxes other than income taxes 261.7 222.9
Profit sharing 143.4 194.0
Other 570.2 488.3
$1,491.9 $1,370.5
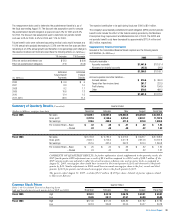
Summary of Quarterly Results (Unaudited) Quarter Ended
(Dollars in Millions, except per share data) November February May August Fiscal Year
Fiscal 2005 Net sales $ 9,889.1 $10,987.0 $10,830.6 $ 10,494.9 $ 42,201.6
Gross profit 2,707.9 3,130.6 3,016.2 2,933.1 11,787.8
Net earnings 328.6 490.9 411.0 329.0 1,559.5
Per Common Share – Basic $ .32 $ .48 $ .41 $ .32 $ 1.53
– Diluted .32 .48 .40 .32 1.52
Fiscal 2004 Net sales $ 8,720.8 $ 9,782.2 $ 9,578.5 $ 9,426.7 $ 37,508.2
Gross profit 2,300.1 2,705.6 2,577.8 2,614.3 10,197.8
Net earnings 251.5 431.6 342.3 324.4 1,349.8
Per Common Share – Basic $ .25 $ .42 $ .33 $ .32 $ 1.32
– Diluted .24 .42 .33 .32 1.31
COMMENTS ON QUARTERLY RESULTS: In further explanation of and supplemental to the quarterly results, the
2005 fourth quarter LIFO adjustment was a credit of $2.0 million compared to a 2004 credit of $48.5 million. If the
2005 interim results were adjusted to reflect the actual inventory inflation rates and inventory levels as computed at
August 31, 2005, earnings per share would have increased in the second quarter by $.01 and decreased in the fourth
quarter by $.01. Similar adjustments in 2004 would have increased earnings per share in the first, second and third
quarters by $.01 per quarter and decreased earnings per share in the fourth quarter by $.03.
The quarter ended August 31, 2005, includes $54.7 million ($.033 per share, diluted) of pre-tax expenses related
to Hurricane Katrina.
Common Stock Prices Quarter Ended
Below is the Consolidated Transaction Reporting System
high and low sales price for each quarter of fiscal 2005 and 2004. November February May August Fiscal Year
Fiscal 2005 High $ 39.51 $ 44.19 $ 46.75 $ 49.01 $ 49.01
Low 35.05 38.11 41.51 44.00 35.05
Fiscal 2004 High $ 37.00 $ 37.42 $ 35.80 $ 37.82 $ 37.82
Low 30.18 33.63 32.00 34.27 30.18