Walgreens 2005 Annual Report Download - page 32
Download and view the complete annual report
Please find page 32 of the 2005 Walgreens annual report below. You can navigate through the pages in the report by either clicking on the pages listed below, or by using the keyword search tool below to find specific information within the annual report.-
 1
1 -
2
-
3
-
4
-
5
-
6
-
7
-
8
-
9
-
10
-
11
-
12
-
13
-
14
-
15
-
16
-
17
-
18
-
19
-
20
-
21
-
 22
22 -
 23
23 -
 24
24 -
 25
25 -
 26
26 -
 27
27 -
 28
28 -
 29
29 -
 30
30 -
 31
31 -
 32
32 -
 33
33 -
 34
34 -
 35
35 -
 36
36 -
 37
37 -
 38
38
 |
 |

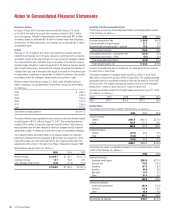
Retirement Benefits
The principal retirement plan for employees is the Walgreen Profit-Sharing
Retirement Trust to which both the company and the employees contribute. The
company’s contribution, which is determined annually at the discretion of the Board
of Directors, has historically related to pre-tax income. The profit-sharing provision
was $218.5 million in 2005, $193.6 million in 2004 and $168.0 million in 2003.
The company’s contributions were $262.3 million for 2005, $161.5 million for
2004 and $138.3 million for 2003.
The company provides certain health insurance benefits for retired employees
who meet eligibility requirements, including age, years of service and date of hire.
This year the company announced a change to the retiree medical and prescription
drug plans, which impacts the company’s benefit obligation. For a select group of
eligible employees, the company will contribute a flat dollar contribution towards
retiree medical and prescription drug coverage based on years of service. This flat
dollar contribution will be indexed on an annual basis. The costs of these benefits
are accrued over the period earned. The company’s postretirement health benefit
plans are not funded.
Components of net periodic benefit costs (In Millions):
2005 2004 2003
Service cost $ 22.0 $19.3 $10.2
Interest cost 23.6 22.5 15.7
Amortization of actuarial loss 10.6 9.9 4.9
Amortization of prior service cost (3.6) (.4) (.4)
Transition obligation 4.9 ——
Total postretirement benefit cost $ 57.5 $51.3 $30.4
Change in benefit obligation (In Millions):
2005 2004
Benefit obligation at September 1 $ 392.5 $349.6
Service cost 22.0 19.3
Interest cost 23.6 22.5
Amendments (36.7) (26.3)
Actuarial loss (gain) (6.6) 33.0
Benefit payments (8.7) (7.1)
Participants contributions .8 1.5
Transition obligation 4.9 —
Benefit obligation at August 31 $ 391.8 $392.5
Change in plan assets (In Millions):
2005 2004
Plan assets at fair value at September 1 $— $—
Plan participants contributions .8 1.5
Employer contributions 7.9 5.6
Benefits paid (8.7) (7.1)
Plan assets at fair value at August 31 $— $—
Funded status (In Millions):
2005 2004
Funded status $ (391.8) $(392.5)
Unrecognized actuarial loss 203.0 220.1
Unrecognized prior service cost (65.2) (32.1)
Accrued benefit cost at August 31 $(254.0) $(204.5)
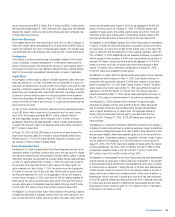
A summary of information relative to the company’s stock option plans follows:
Options Outstanding Options Exercisable
Weighted- Weighted-
Average Average
Exercise Exercise
Shares Price Shares Price
August 31, 2002 34,301,035 $22.35 13,786,657 $ 9.71
Granted 17,701,356 28.86
Exercised (2,747,055) 8.79
Canceled/Forfeited (2,924,991) 28.95
August 31, 2003 46,330,345 25.23 26,306,122 21.57
Granted 2,953,230 32.33
Exercised (5,867,982) 12.81
Canceled/Forfeited (3,269,011) 28.54
August 31, 2004 40,146,582 27.29 22,103,057 24.84
Granted 9,035,094 36.07
Exercised (4,215,576) 21.85
Canceled/Forfeited (2,060,445) 29.36
August 31, 2005 42,905,655 $29.58 19,896,830 $26.44
The following table summarizes information concerning options outstanding and
exercisable as of August 31, 2005:
Options Outstanding Options Exercisable
Weighted-
Average Weighted- Weighted-
Range of Number Remaining Average Number Average
Exercise Outstanding Contractual Exercise Exercisable Exercise
Prices at 8/31/05 Life Price at 8/31/05 Price
$ 5 to 24 7,065,945 2.33 yrs. $15.23 7,065,945 $15.23
25 to 30 14,610,110 6.40 28.32 5,782,919 29.17
31 to 35 15,675,716 7.66 34.36 4,415,903 33.45
36 to 46 5,553,884 7.20 37.63 2,632,063 38.80
$ 5 to 46 42,905,655 6.30 yrs. $29.58 19,896,830 $26.44
The weighted-average fair value and exercise price of options granted for fiscal
2005, 2004 and 2003 were as follows:
2005 2004 2003
Granted at market price –
Weighted-average fair value $13.47 $12.17 $10.36
Weighted-average exercise price 36.45 32.33 28.80
Granted below market price –
Weighted-average fair value 12.78 14.03 13.37
Weighted-average exercise price 35.89 32.14 31.48
The fair value of each option grant used in the pro forma net earnings and net
earnings per share was determined using the Black-Scholes option pricing model
with weighted-average assumptions used for grants in fiscal 2005, 2004 and 2003:
2005 2004 2003
Risk-free interest rate 3.80% 4.07% 3.36%
Average life of option (years) 7.2 7.0 7.0
Volatility 28.14% 28.56% 28.04%
Dividend yield .58% .38% .29%
30 2005 Annual Report
Notes to Consolidated Financial Statements (continued)