eBay 2013 Annual Report Download - page 119
Download and view the complete annual report
Please find page 119 of the 2013 eBay annual report below. You can navigate through the pages in the report by either clicking on the pages listed below, or by using the keyword search tool below to find specific information within the annual report.-
 1
1 -
2
-
3
-
4
-
5
-
6
-
7
-
8
-
9
-
10
-
11
-
12
-
13
-
14
-
15
-
16
-
17
-
18
-
19
-
20
-
21
-
22
-
23
-
24
-
25
-
26
-
27
-
28
-
29
-
30
-
31
-
32
-
33
-
34
-
35
-
36
-
37
-
38
-
39
-
40
-
41
-
42
-
43
-
44
-
45
-
46
-
47
-
48
-
49
-
50
-
51
-
52
-
53
-
54
-
55
-
56
-
57
-
58
-
59
-
60
-
61
-
62
-
63
-
64
-
65
-
66
-
67
-
68
-
69
-
70
-
71
-
72
-
73
-
74
-
75
-
76
-
77
-
78
-
79
-
80
-
81
-
82
-
83
-
84
-
85
-
86
-
87
-
88
-
89
-
90
-
91
-
92
-
93
-
94
-
95
-
96
-
97
-
98
-
99
-
100
-
101
-
102
-
103
-
104
-
105
-
106
-
107
-
108
-
 109
109 -
 110
110 -
 111
111 -
 112
112 -
 113
113 -
 114
114 -
 115
115 -
 116
116 -
 117
117 -
 118
118 -
 119
119 -
 120
120 -
 121
121 -
 122
122 -
 123
123 -
 124
124 -
 125
125 -
 126
126 -
 127
127 -
 128
128 -
 129
129 -
130
-
131
-
132
-
133
-
134
-
135
-
136
-
137
-
138
-
139
-
140
-
141
-
142
-
143
-
144
-
145
-
146
-
147
-
148
-
149
-
150
-
151
-
152
-
153
-
154
-
155
-
156
-
157
-
158
-
159
-
160
-
161
-
162
-
163
-
164
-
165
-
166
-
167
 |
 |

eBay Inc.
NOTES TO CONSOLIDATED FINANCIAL STATEMENTS—(Continued)
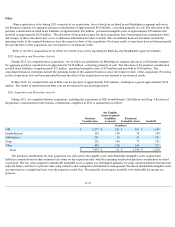
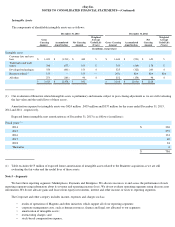
The following tables summarize the allocation of net revenues and long-lived tangible assets based on geography:
Net revenues are attributed to U.S. and international geographies primarily based upon the country in which the seller, payment recipient,
customer, website that displays advertising, or other service provider, as the case may be, is located. Long-lived assets attributed to the U.S. and
international geographies are based upon the country in which the asset is located or owned. Total assets by segment are not presented as that
information is not used to allocate resources or assess performance at the segment level and is not reviewed by our Chief Operating Decision
Maker.
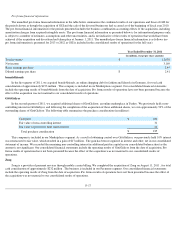
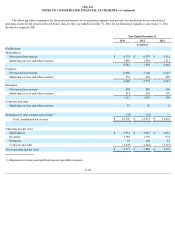
Note 6 – Investments
At December 31, 2013 and 2012 , the estimated fair value of our short-term and long-term investments classified as available for sale, are
as follows:
F-21
Year Ended December 31,
2013
2012
2011
(In millions)
Net revenues:
U.S.
$
7,712
$
6,778
$
5,484
Germany
1,930
1,679
1,539
United Kingdom
2,183
1,889
1,572
Rest of world
4,222
3,726
3,057
Total net revenues
$
16,047
$
14,072
$
11,652
December 31,
2013
2012
(In millions)
Long-lived tangible assets:
U.S.
$
2,756
$
2,727
International
240
222
Total long-lived tangible assets
$
2,996
$
2,949
December 31, 2013
Gross
Amortized
Cost
Gross
Unrealized
Gains
Gross
Unrealized
Losses
Estimated
Fair Value
(In millions)
Short-term investments:
Restricted cash
$
17
$
—
$
—
$
17
Corporate debt securities
3,525
4
—
3,529
Government and agency securities
43
—
—
43
Time deposits and other
49
—
—
49
Equity instruments
12
881
—
893
$
3,646
$
885
$
—
$
4,531
Long-term investments:
Corporate debt securities
4,409
41
(5
)
4,445
Government and agency securities
250
1
—
251
$
4,659
$
42
$
(5
)
$
4,696