eBay 2013 Annual Report Download - page 123
Download and view the complete annual report
Please find page 123 of the 2013 eBay annual report below. You can navigate through the pages in the report by either clicking on the pages listed below, or by using the keyword search tool below to find specific information within the annual report.-
 1
1 -
2
-
3
-
4
-
5
-
6
-
7
-
8
-
9
-
10
-
11
-
12
-
13
-
14
-
15
-
16
-
17
-
18
-
19
-
20
-
21
-
22
-
23
-
24
-
25
-
26
-
27
-
28
-
29
-
30
-
31
-
32
-
33
-
34
-
35
-
36
-
37
-
38
-
39
-
40
-
41
-
42
-
43
-
44
-
45
-
46
-
47
-
48
-
49
-
50
-
51
-
52
-
53
-
54
-
55
-
56
-
57
-
58
-
59
-
60
-
61
-
62
-
63
-
64
-
65
-
66
-
67
-
68
-
69
-
70
-
71
-
72
-
73
-
74
-
75
-
76
-
77
-
78
-
79
-
80
-
81
-
82
-
83
-
84
-
85
-
86
-
87
-
88
-
89
-
90
-
91
-
92
-
93
-
94
-
95
-
96
-
97
-
98
-
99
-
100
-
101
-
102
-
103
-
104
-
105
-
106
-
107
-
108
-
109
-
110
-
111
-
112
-
 113
113 -
 114
114 -
 115
115 -
 116
116 -
 117
117 -
 118
118 -
 119
119 -
 120
120 -
 121
121 -
 122
122 -
 123
123 -
 124
124 -
 125
125 -
 126
126 -
 127
127 -
 128
128 -
 129
129 -
 130
130 -
 131
131 -
 132
132 -
 133
133 -
134
-
135
-
136
-
137
-
138
-
139
-
140
-
141
-
142
-
143
-
144
-
145
-
146
-
147
-
148
-
149
-
150
-
151
-
152
-
153
-
154
-
155
-
156
-
157
-
158
-
159
-
160
-
161
-
162
-
163
-
164
-
165
-
166
-
167
 |
 |

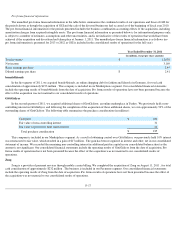
eBay Inc.
NOTES TO CONSOLIDATED FINANCIAL STATEMENTS—(Continued)
Our financial assets and liabilities are valued using market prices on both active markets (level 1) and less active markets (level 2). Level 1
instrument valuations are obtained from real-time quotes for transactions in active exchange markets involving identical assets. Level 2
instrument valuations are obtained from readily available pricing sources for comparable instruments, identical instruments in less active
markets, or models using market observable inputs. The majority of our derivative instruments are valued using pricing models that take into
account the contract terms as well as multiple inputs where applicable, such as equity prices, interest rate yield curves, option volatility and
currency rates. Our derivative instruments are primarily short-term in nature, generally one month to one year in duration. Certain foreign
currency contracts designated as cash flow hedges may have a duration of up to 18 months. We did not have any transfers of financial
instruments between valuation levels during 2013 or 2012.
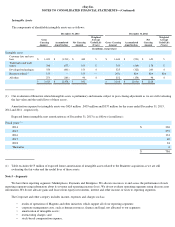
Cash and cash equivalents are short-term, highly liquid investments with original or remaining maturities of three months or less when
purchased and are comprised primarily of bank deposits, money market funds and commercial paper. We had total funds receivable and
customer accounts of $9.3 billion as of December 31, 2013 , $3.6 billion of which is invested in short-term investments.
In addition, we had cost and equity method investments of approximately $269 million and $327 million included in long-
term investments
on our consolidated balance sheet at December 31, 2013 and 2012 , respectively.
As of December 31, 2013 and 2012, we held no direct investments in auction rate securities, collateralized debt obligations, structured
investment vehicles or mortgage-backed securities.
Other financial instruments, including accounts receivable, loans and interest receivable, accounts payable, funds receivable, certain
customer accounts, funds payable and amounts due to customers, are carried at cost, which approximates their fair value because of the short-
term nature of these instruments.
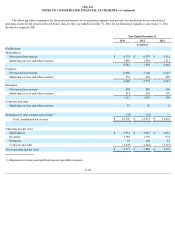
F-24
Description
Balance as of
December 31, 2012
Quoted Prices in
Active Markets for
Identical Assets
(Level 1)
Significant Other
Observable Inputs
(Level 2)
(In millions)
Assets:
Cash and cash equivalents
$
6,817
$
5,685
$
1,132
Short-term investments:
Restricted cash
15
15
—
Corporate debt securities
1,153
—
1,153
Government and agency securities
20
—
20
Time deposits
765
—
765
Equity instruments
638
638
—
Total short-term investments
2,591
653
1,938
Derivatives
55
—
55
Long-term investments:
Corporate debt securities
2,669
—
2,669
Government and agency securities
42
—
42
Total long-term investments
2,711
—
2,711
Total financial assets
$
12,174
$
6,338
$
5,836
Liabilities:
Derivatives
$
86
$
—
$
86