eBay 2013 Annual Report Download - page 65
Download and view the complete annual report
Please find page 65 of the 2013 eBay annual report below. You can navigate through the pages in the report by either clicking on the pages listed below, or by using the keyword search tool below to find specific information within the annual report.-
 1
1 -
2
-
3
-
4
-
5
-
6
-
7
-
8
-
9
-
10
-
11
-
12
-
13
-
14
-
15
-
16
-
17
-
18
-
19
-
20
-
21
-
22
-
23
-
24
-
25
-
26
-
27
-
28
-
29
-
30
-
31
-
32
-
33
-
34
-
35
-
36
-
37
-
38
-
39
-
40
-
41
-
42
-
43
-
44
-
45
-
46
-
47
-
48
-
49
-
50
-
51
-
52
-
53
-
54
-
 55
55 -
 56
56 -
 57
57 -
 58
58 -
 59
59 -
 60
60 -
 61
61 -
 62
62 -
 63
63 -
 64
64 -
 65
65 -
 66
66 -
 67
67 -
 68
68 -
 69
69 -
 70
70 -
 71
71 -
 72
72 -
 73
73 -
 74
74 -
 75
75 -
76
-
77
-
78
-
79
-
80
-
81
-
82
-
83
-
84
-
85
-
86
-
87
-
88
-
89
-
90
-
91
-
92
-
93
-
94
-
95
-
96
-
97
-
98
-
99
-
100
-
101
-
102
-
103
-
104
-
105
-
106
-
107
-
108
-
109
-
110
-
111
-
112
-
113
-
114
-
115
-
116
-
117
-
118
-
119
-
120
-
121
-
122
-
123
-
124
-
125
-
126
-
127
-
128
-
129
-
130
-
131
-
132
-
133
-
134
-
135
-
136
-
137
-
138
-
139
-
140
-
141
-
142
-
143
-
144
-
145
-
146
-
147
-
148
-
149
-
150
-
151
-
152
-
153
-
154
-
155
-
156
-
157
-
158
-
159
-
160
-
161
-
162
-
163
-
164
-
165
-
166
-
167
 |
 |

ITEM 7: MANAGEMENT'S DISCUSSION AND ANALYSIS OF FINANCIAL CONDITION AND RESULTS OF OPERATIONS
FORWARD-LOOKING STATEMENTS
This Annual Report on Form 10-K contains forward-looking statements within the meaning of Section 27A of the Securities Act of 1933
and Section 21E of the Securities Exchange Act of 1934, including statements that involve expectations, plans or intentions (such as those
relating to future business, future results of operations or financial condition, new or planned features or services, or management strategies).
You can identify these forward-looking statements by words such as “may,” “will,” “would,” “should,” “could,” “expect,” “anticipate,”
“believe,” “estimate,” “intend,” “plan” and other similar expressions. These forward-looking statements involve risks and uncertainties that
could cause our actual results to differ materially from those expressed or implied in our forward-looking statements. Such risks and
uncertainties include, among others, those discussed in “Item 1A: Risk Factors” of this Annual Report on Form 10-K, as well as in our
consolidated financial statements, related notes, and the other information appearing elsewhere in this report and our other filings with the
SEC. We do not intend, and undertake no obligation, to update any of our forward-looking statements after the date of this report to reflect
actual results or future events or circumstances. Given these risks and uncertainties, readers are cautioned not to place undue reliance on such
forward
-looking statements. You should read the following Management's Discussion and Analysis of Financial Condition and Results of
Operations in conjunction with the consolidated financial statements and the related notes included in this report.
Overview
We have three reportable business segments: Marketplaces, Payments and Enterprise. Our Marketplaces segment includes our eBay.com
platform and its localized counterparts and our other online trading platforms, such as our online classifieds sites and StubHub. Our Payments
segment is comprised of PayPal and Bill Me Later. Our Enterprise segment was added upon the completion of our acquisition of GSI
Commerce, Inc. (GSI) on June 17, 2011. The results of our Enterprise segment have been included in our consolidated results of operations from
the acquisition date.
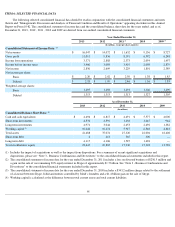
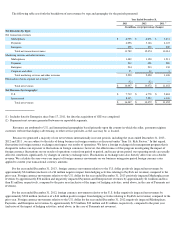
In 2013 , net revenues increased 14% to $16.0 billion compared to $14.1 billion in 2012 , driven primarily by increases in net revenues
from each of our business segments. We achieved an operating margin of 21% in each of 2013 and 2012 . Our diluted earnings per share
increased to $2.18 in 2013 , a $0.19 increase per share compared to 2012 , driven primarily by growth in 2013 net revenues partially offset by a
higher effective tax rate. We generated cash flow from operations of approximately $5.0 billion in 2013 compared to $3.8 billion in 2012 .
Our Marketplaces segment total net revenues increased $886 million , or 12% , in 2013 compared to 2012 . The increase in total net
revenues was driven primarily by an increase in GMV (as defined below) excluding vehicles of 13% , which was due to continued growth in the
U.S. and internationally. Our Marketplaces segment operating margin increased 0.7 percentage points in 2013 compared to 2012 due primarily
to marketing program efficiencies that were partially offset by continued investments in our site operations infrastructure and business initiatives.
Our Payments segment total net revenues increased $1.1 billion , or 19% , in 2013 compared to 2012 . The increase in total net revenues
was driven primarily by an increase in net TPV (as defined below) of 24% and strong growth in Bill Me Later. Our Payments segment operating
margin decreased 0.4 percentage points in 2013 compared to 2012 , due primarily to a lower take rate partially offset by operating efficiencies.
Our Enterprise segment total net revenues increased $29 million , or 3% , in 2013 compared to 2012 . The increase in total net revenues
was driven primarily by an increase in Merchandise Sales (as defined below) of 14% in 2013 compared to 2012. Our Enterprise segment
operating margin decreased 3.6 percentage points for 2013 compared to 2012 due primarily to a lower take rate on Merchandise Sales as well as
continued investment in our Enterprise commerce technologies.
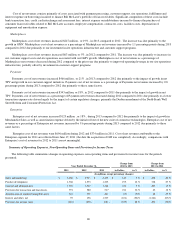
In 2012, net revenues increased 21% to $14.1 billion compared to $11.7 billion in 2011, driven primarily by increases in net revenues
from each of our business segments. We achieved an operating margin of 21% in 2012 compared to 20% in 2011. Our diluted earnings per share
decreased to $1.99 in 2012, a $0.47 decrease per share compared to 2011, driven primarily by the gain resulting from the sale of our remaining
30% equity interest in Skype in 2011, offset in part by growth in 2012 net revenues and a lower effective tax rate. We generated cash flow from
operations of approximately $3.8 billion in 2012 compared to $3.3 billion in 2011.
62